StatQuest: Logistic Regression
TLDRIn this StatQuest episode, host Josh Starmer introduces logistic regression, a machine learning technique that predicts binary outcomes. Unlike linear regression, which predicts continuous values, logistic regression uses an S-shaped curve to estimate probabilities. The video explains how it fits data using maximum likelihood rather than least squares, and how it can handle both continuous and discrete variables. It also discusses model comparison and the use of Wald's tests to determine the significance of variables, highlighting its popularity in classification tasks.
Takeaways
- 📊 Logistic regression is a technique used in both traditional statistics and machine learning.
- 🔍 It differs from linear regression as it predicts binary outcomes (true/false) rather than continuous values.
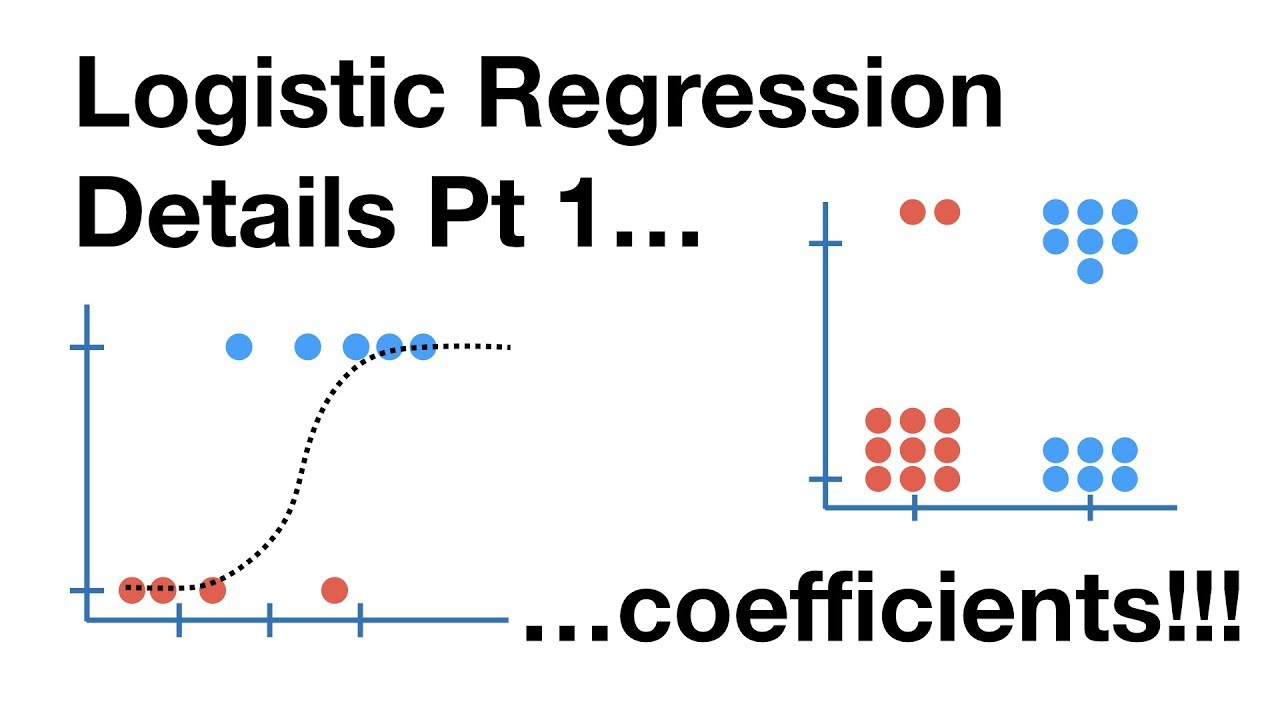
- 📈 Logistic regression fits an S-shaped logistic function to the data instead of a straight line.
- 🐭 The probability output indicates the likelihood of an instance belonging to a certain category (e.g., a mouse being obese).
- 🤣 The script uses the example of predicting obesity in mice based on weight to explain the concept.
- 🔢 It highlights that logistic regression can handle both continuous (e.g., weight, age) and discrete (e.g., genotype, astrological sign) data.
- 🔄 Logistic regression uses maximum likelihood estimation instead of least squares to fit the model to the data.
- 🚫 Unlike linear regression, logistic regression does not calculate R-squared or residuals.
- 🌟 It is commonly used for classification tasks, often setting a probability threshold (e.g., 50%) to categorize instances.
- 🔍 Variables can be tested for their significance in the model using methods like Wald's tests.
- 🎓 The script encourages viewers to subscribe for more educational content and to leave suggestions for future topics.
Q & A
What is logistic regression?
-Logistic regression is a statistical technique used for both traditional statistics and machine learning. It predicts whether an outcome is true or false, as opposed to linear regression which predicts continuous outcomes.
How does logistic regression differ from linear regression?
-Logistic regression fits an S-shaped logistic function to the data instead of a straight line. It predicts probabilities of a binary outcome (e.g., whether a mouse is obese or not), and uses maximum likelihood estimation instead of least squares to fit the model.
What is the logistic function's role in logistic regression?
-The logistic function maps the linear combination of the predictor variables to a probability value between 0 and 1, indicating the likelihood of the outcome being true (e.g., the probability of a mouse being obese based on its weight).
How does one interpret the probability output by logistic regression?
-The output probability from logistic regression can be used to classify observations. For example, if the probability of a mouse being obese is greater than 0.5, the model classifies the mouse as obese; otherwise, it is classified as not obese.
What types of data can logistic regression handle?
-Logistic regression can handle both continuous data (like weight and age) and discrete data (like genotype and astrological sign) to make predictions and classifications.
How can we determine if a variable is useful in logistic regression?
-We use Wald's tests to determine if a variable's effect on the prediction is significantly different from zero. If not, the variable is not helping the prediction and can be omitted from the model.
What is the significance of the maximum likelihood method in logistic regression?
-The maximum likelihood method is used to estimate the parameters of the logistic regression model. It finds the set of parameter values that makes the observed data most probable, thus providing the best fit to the data.
How does logistic regression handle multiple types of predictors?
-Logistic regression can model complex relationships by incorporating both continuous and discrete predictors into the same model. Each type of predictor contributes to the probability estimation in its own way.
What is the role of the R-squared value in linear regression, and how does it compare to logistic regression?
-In linear regression, R-squared measures the proportion of the variance for the dependent variable that's explained by the independent variables. However, logistic regression does not calculate R-squared as it doesn't use the concept of residuals; instead, it focuses on the maximum likelihood estimation.
Can we compare simple and complex logistic regression models like we do with linear regression?
-While we can compare models in linear regression using R-squared, logistic regression doesn't have an equivalent measure. Instead, we assess the significance of individual variables to determine the model's complexity and usefulness.
Why might we choose a simpler logistic regression model over a more complex one?
-A simpler model might be preferred if it performs comparably to a more complex model but with fewer parameters. This avoids overfitting and makes the model easier to interpret, while also saving computational resources.
Outlines
📊 Introduction to Logistic Regression
This paragraph introduces the concept of logistic regression, a statistical technique applicable to both traditional statistics and machine learning. It begins by reviewing linear regression from a previous Stat Quest video, highlighting the ability to calculate the correlation between variables, determine statistical significance, and make predictions. The paragraph then transitions to discussing logistic regression, which predicts binary outcomes (e.g., whether a mouse is obese or not) using an S-shaped logistic function instead of a straight line. It explains how logistic regression provides probabilities and classifies new samples based on these probabilities, using weight and other variables like genotype for prediction.
🔢 Logistic Regression's Application and Model Comparison
This paragraph delves into the application of logistic regression with various types of data, both continuous (like weight and age) and discrete (like genotype and astrological sign). It discusses the ability to test each variable's usefulness in predicting the outcome, but unlike linear regression, logistic regression doesn't allow for an easy comparison between complex and simple models. Instead, it focuses on whether the effect of a variable is significantly different from zero, using Wald's tests for this purpose. The paragraph also touches on how logistic regression can save time and space by eliminating unhelpful variables from the model, and it concludes by emphasizing logistic regression's popularity due to its capability to handle different data types and provide probabilistic classifications.
Mindmap
Keywords
💡Logistic Regression
💡Linear Regression
💡R-squared
💡P-value
💡Machine Learning
💡Multiple Regression
💡Genotype
💡Classification
💡Astrological Sign
💡Maximum Likelihood
💡Wald's Tests
Highlights
Logistic regression is a technique used for both traditional statistics and machine learning.
Logistic regression predicts binary outcomes (true/false) rather than continuous values.
The logistic function used in regression is S-shaped, ranging from 0 to 1, representing probabilities.
A heavy mouse has a high probability of being obese according to logistic regression.
Logistic regression is often used for classification based on a 50% probability threshold.
Simple logistic regression models can predict obesity using a single variable like weight.
More complex models can incorporate multiple variables such as weight, genotype, and age for predicting obesity.
Logistic regression can work with both continuous data (e.g., weight and age) and discrete data (e.g., genotype and astrological sign).
Variables in logistic regression models can be tested for their usefulness in predicting outcomes.
Unlike linear regression, logistic regression uses maximum likelihood estimation for fitting the model to data.
Maximum likelihood involves calculating the probability of observing the data given the model and adjusting the model to maximize this probability.
Logistic regression does not use least squares or calculate R-squared, unlike linear regression.
Wald's tests are used to determine if a variable's effect on prediction is significantly different from zero.
In the example given, astrological signs were found to be useless in predicting obesity.
Logistic regression's ability to handle different data types and provide probabilities makes it a popular machine learning method.
The method allows for the comparison of simple and complex models to determine the necessity of additional variables.
Logistic regression helps in saving time and space by identifying and excluding non-significant variables from models.
Transcripts


5.0 / 5 (0 votes)
Thanks for rating: