Acceleration vs. time graphs | One-dimensional motion | Physics | Khan Academy
TLDRThe video script discusses the concept of acceleration versus time graphs, emphasizing their abstract nature and their importance in understanding an object's motion. It explains that while the graph cannot directly provide an object's velocity, it can reveal changes in velocity over time. The key takeaway is that the area under the acceleration curve represents the change in velocity, which, when combined with an initial velocity, allows for the determination of velocity at any point. The video also introduces the concept of 'jerk' as the rate of change of acceleration over time, adding another layer of complexity to motion analysis.
Takeaways
- 📈 Acceleration vs. time graphs can be challenging due to the abstract nature of acceleration and the complexity of interpreting graphs.
- 🐶 The motion of an object, such as a dog named Daisy, cannot be directly inferred from the acceleration graph without additional information.
- 🔄 Acceleration is defined as the change in velocity over the change in time, which links the graph to the object's velocity.
- 📐 The area under the acceleration graph represents the change in velocity, which is crucial for determining the object's velocity at different times.
- 🔺 The change in velocity for a given time interval can be calculated by multiplying the acceleration by the time interval (Δv = a × Δt).
- 📊 The geometric aspect of acceleration graphs allows for the calculation of change in velocity by finding the area of shapes (rectangles or triangles) under the curve.
- 🔻 When dealing with varying acceleration, the method of breaking it down into smaller intervals and calculating the area can approximate the total change in velocity.
- 🚫 The slope of the acceleration vs. time graph represents the rate of change of acceleration, also known as 'jerk', which is not commonly used but has its applications.
- 🔄 To find the velocity at any point, start with the known velocity at a specific time and add the change in velocity (area under the graph) for the desired time interval.
- 📌 It is essential to ensure that the time intervals used for calculating the change in velocity and the area under the graph are consistent and correspond to the same time period.
Q & A
What is the main challenge in understanding acceleration versus time graphs?
-The main challenge is that acceleration is an abstract concept for many people, and combining it with graphs, which some people also find difficult, makes it harder to understand. Additionally, one cannot directly determine the velocity of an object from the graph without additional information.
How is the area under an acceleration versus time graph related to an object's motion?
-The area under the graph represents the change in velocity over the time interval considered. This is because acceleration is defined as the change in velocity over time, and the area of a shape (like a rectangle or triangle) on the graph corresponds to this change in velocity.
What is the significance of the geometric aspect of acceleration versus time graphs?
-The geometric aspect simplifies the process of finding the change in velocity. By calculating the area of shapes (rectangles or triangles) under the curve, one can determine the change in velocity without having to deal with varying acceleration values directly.
How can one find the velocity of an object at a specific time, given its acceleration versus time graph?
-To find the velocity at a specific time, you first need to know the object's velocity at another point in time. Then, calculate the change in velocity by finding the area under the acceleration versus time graph between the two times. Finally, add this change in velocity to the initial velocity to get the velocity at the desired time.
What is the term used for the rate of change of acceleration with respect to time?
-The term used for the rate of change of acceleration with respect to time is 'jerk.' It is represented by the slope of the acceleration versus time graph.
How does the concept of 'jerk' apply to the acceleration versus time graph?
-Jerk is the slope of the acceleration versus time graph, representing the change in acceleration over the change in time. It provides an additional layer of analysis for the object's motion, although it is not as commonly used as velocity or acceleration.
Why is it important to ensure that time intervals agree on both sides of an acceleration versus time graph?
-Ensuring that time intervals agree on both sides of the graph is crucial for accurately calculating the change in velocity. The area under the curve (change in velocity) must correspond to the correct time interval being considered, otherwise the calculated velocity will be incorrect.
How can one calculate the change in velocity for a non-rectangular area on the acceleration versus time graph?
-For non-rectangular areas, such as triangles, the change in velocity is calculated by finding the area using the appropriate geometric formula (e.g., 1/2 base times height for triangles). This area then represents the change in velocity over the corresponding time interval.
What is the relationship between the height and width of a rectangle on the acceleration versus time graph?
-The height of the rectangle on the graph represents the acceleration, while the width represents the time interval (delta t). The area of the rectangle, which is height times width, gives the change in velocity over that time interval.
How does one estimate the area under a curve using rectangles?
-One can estimate the area under the curve by dividing the curve into small rectangles, calculating the area of each rectangle (height times width), and summing these areas. As the rectangles become infinitely small, the sum of their areas approaches the true area under the curve.
What happens if the area under the acceleration versus time graph is negative?
-If the area is negative, it indicates that the change in velocity is in the opposite direction of the positive velocity direction. This means the object is decelerating or moving in the negative velocity direction.
How can the concept of 'delta v' be used to find the velocity at any point in time?
-By knowing the initial velocity and the change in velocity (delta v) at different time intervals, one can calculate the velocity at any point in time. This is done by adding the delta v to the initial velocity or to the velocity at any known time point.
Outlines
📈 Understanding Acceleration vs. Time Graphs
This paragraph introduces the concept of acceleration versus time graphs, emphasizing their complexity due to the abstract nature of acceleration and the general discomfort with graphs. The instructor uses the example of a dog named Daisy to illustrate how the graph can show acceleration but not directly the velocity. The key point is that additional information is needed to determine velocity from the graph. The relationship between acceleration and velocity is explained through the definition of acceleration as the change in velocity over time. The paragraph concludes with the explanation that the area under the graph represents the change in velocity, which is crucial for understanding the motion of the object.
🔄 Calculating Velocity from Acceleration Graph
The second paragraph delves into the method of calculating changes in velocity using the area under the acceleration graph. The instructor clarifies that while the graph represents changes in acceleration, it does not directly indicate whether the object is speeding up or slowing down. The concept is illustrated by calculating the change in velocity for specific time intervals, using the formula that relates acceleration, time, and change in velocity. The paragraph highlights the geometric aspect of the graph, where the area of rectangles or triangles under the curve can be used to find the change in velocity. This is important because, with the initial velocity known, one can determine the velocity at any other point by adding the change in velocity obtained from the graph.
📉 Interpreting Negative Acceleration and Jerk
The final paragraph addresses the calculation of velocity when the object experiences negative acceleration, represented by the area under the curve being negative. The instructor explains how to find the change in velocity for a time interval that includes a transition from positive to negative acceleration. The concept of 'jerk' is introduced as the rate of change of acceleration with respect to time, which is the slope of the acceleration versus time graph. Although jerk is not commonly used, it represents an additional layer of motion analysis beyond velocity and acceleration. The paragraph concludes with a recap of the main points: the area under the graph gives the change in velocity, and the slope of the graph gives the jerk.
Mindmap
Keywords
💡Acceleration
💡Time Graphs
💡Velocity
💡Change in Velocity
💡Area under the Graph
💡Jerk
💡Daisy
💡Rectangle and Triangle Areas
💡Initial Velocity
💡Time Intervals
💡Slope
Highlights
Acceleration versus time graphs are considered the hardest among motion graphs due to the abstract nature of acceleration and the general dislike for graphs.
To understand the motion of an object from an acceleration graph, one must have extra information about the object's velocity at a known moment.
The graph can represent an object's acceleration, such as the acceleration of a dog named Daisy while playing catch.
From the graph, it's not directly evident whether the object is speeding up or slowing down.
Acceleration is defined as the change in velocity over the change in time, linking the graph to the object's velocity.
The change in velocity over a time interval is equal to the acceleration during that interval times the interval itself.
The area under the acceleration graph represents the change in velocity, which is crucial for understanding the object's motion.
The geometric aspect of the graph allows for easier analysis by relating the area to the change in velocity.
The area of a rectangle can represent the change in velocity, as it is equivalent to the product of acceleration and time (delta t).
Even with varying acceleration, the area of a triangle can be used to find the change in velocity by using the formula 1/2 base times height.
By knowing the velocity at one point and the change in velocity, one can determine the velocity at any other point in time.
The slope of an acceleration versus time graph represents the rate of change of acceleration, also known as jerk.
Jerk, though not commonly used, is the change in acceleration with respect to time and has its specific applications.
When analyzing an acceleration graph, it's important to ensure that the time intervals on both sides of the equation agree with each other.
The concept of acceleration and its representation through graphs is essential for understanding an object's motion and change in velocity.
The area under the curve to the horizontal axis can represent a negative area, indicating a change in velocity in the opposite direction.
By adding the change in velocity (area) to the initial velocity, one can find the final velocity at any given time.
The method of breaking down complex areas into smaller, manageable rectangles or triangles allows for easier calculation of the change in velocity.
Understanding the relationship between acceleration, velocity, and time is fundamental to the study of motion and kinetics.
Transcripts
Browse More Related Video
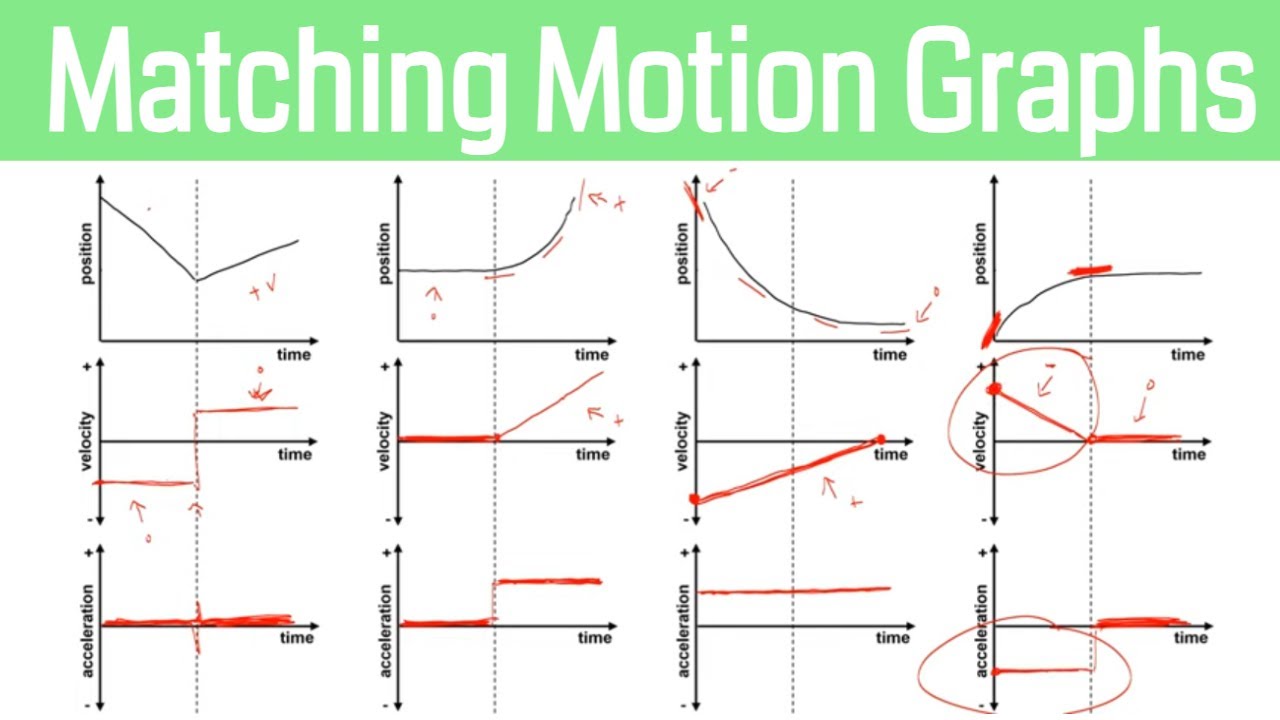
How to Match Motion Graphs in Physics
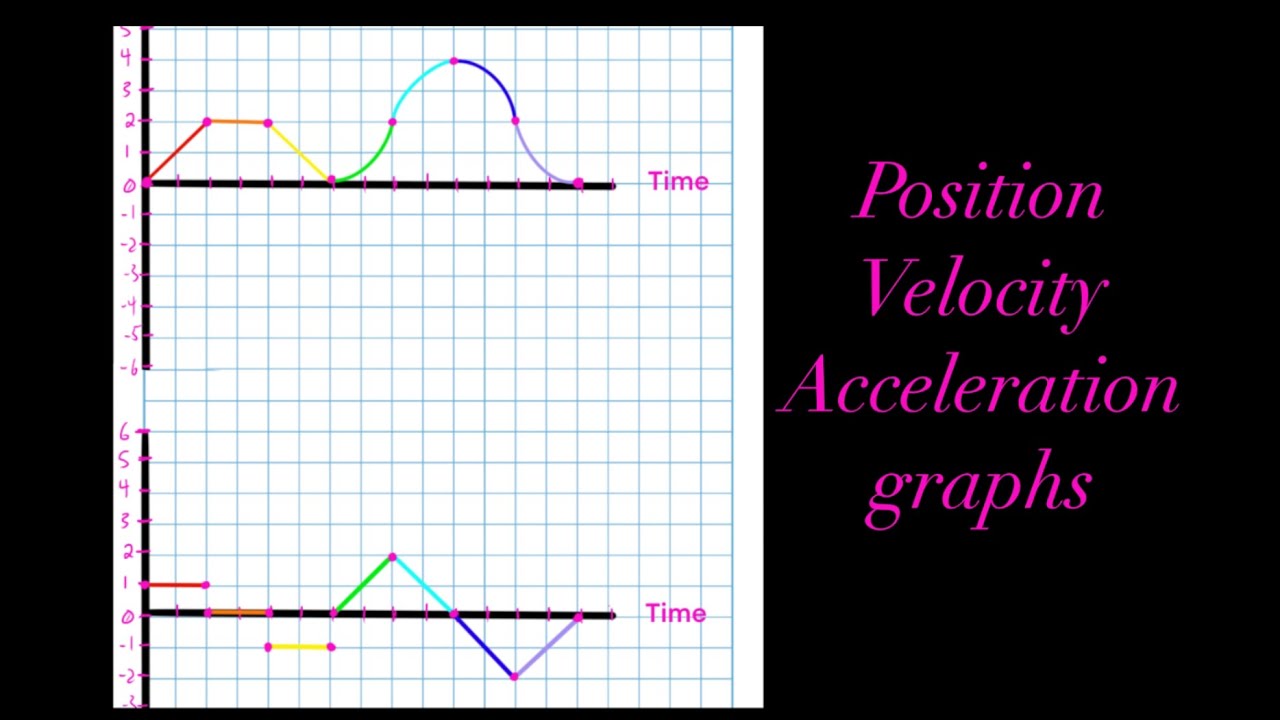
Position vs Time, Velocity vs Time & Acceleration vs Time Graph (Great Trick to Solve Every Graph!!)

High School Physics: Graphing Motion

GCSE Physics - Velocity Time Graphs #54
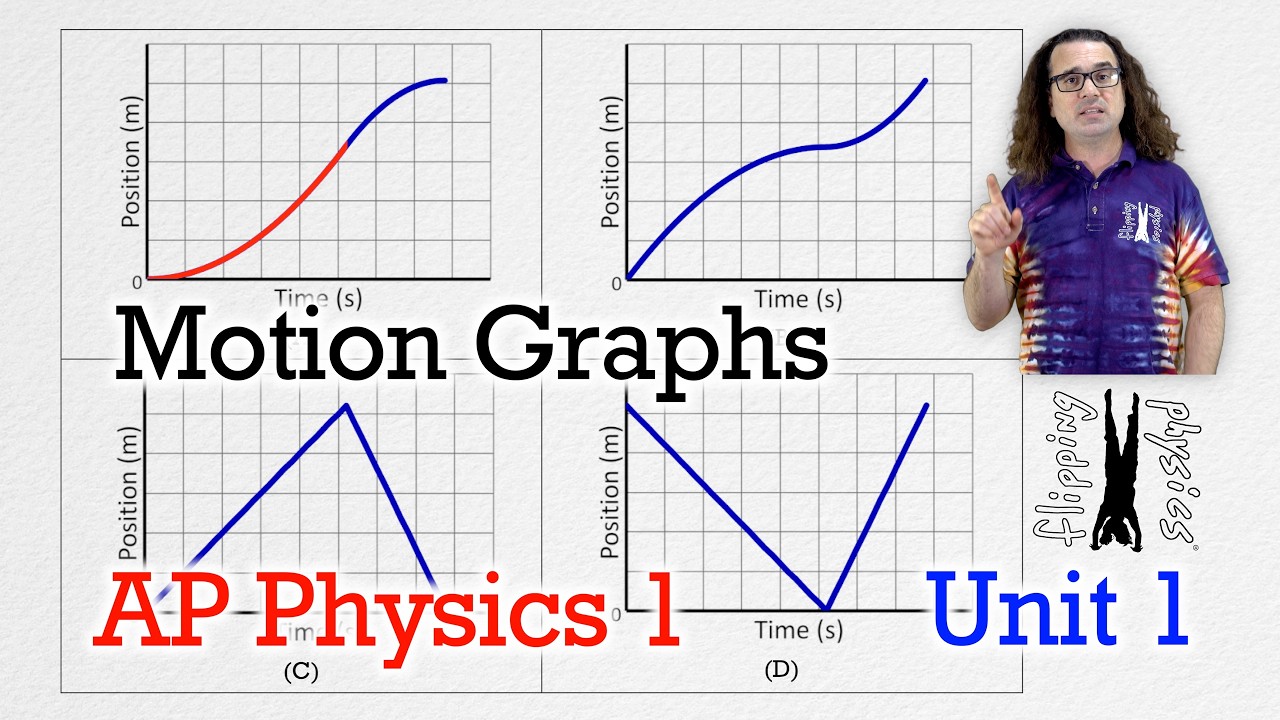
Motion Graphs - AP Physics 1: Kinematics Review Supplement

Velocity Time Graphs, Acceleration & Position Time Graphs - Physics
5.0 / 5 (0 votes)
Thanks for rating: