First Derivative Test
TLDRThis video script offers a comprehensive guide on utilizing the first derivative test to identify the relative extrema of a function. It explains the concept through various examples, demonstrating how the sign changes in the first derivative can indicate a relative minimum or maximum. The script walks through the process of finding the first derivative, setting it to zero to find critical points, and using a sign chart to determine the nature of these points. It emphasizes the importance of the first derivative's sign transition from negative to positive for a minimum and from positive to negative for a maximum. The examples provided cover different scenarios, including functions with and without relative extrema, reinforcing the method's application and interpretation.
Takeaways
- 📈 The first derivative test is a method to determine the relative extrema (minima and maxima) of a function.
- 🔄 A relative minimum occurs where the first derivative changes from negative to positive.
- 🔄 A relative maximum occurs where the first derivative changes from positive to negative.
- 🌀 If the first derivative does not change sign, there is no relative maximum or minimum at that point.
- 🧮 To apply the first derivative test, find the first derivative of the function, set it to zero to find critical points, and then use a sign chart to determine extrema.
- 📊 For the function f(x) = x^2 - 4x + 5, the first derivative is 2x - 4, and the critical point at x=2 corresponds to a relative minimum with the function value of 1.
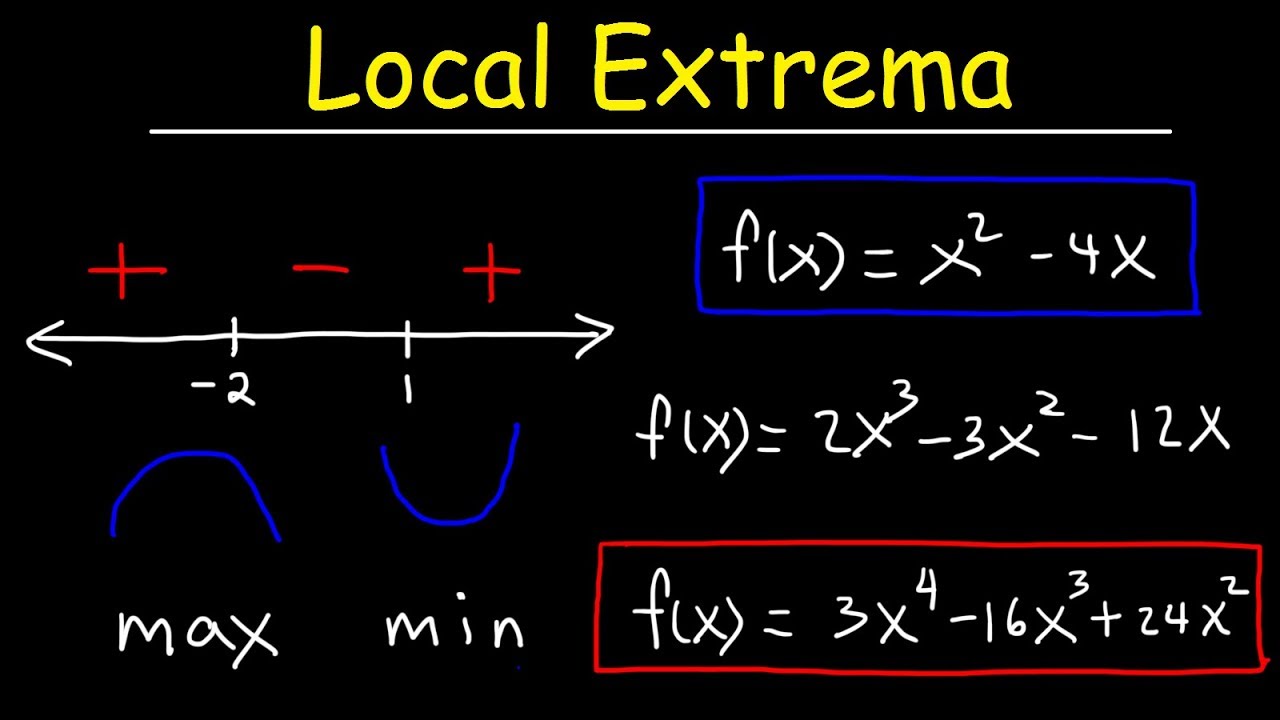
- 📈 For the function f(x) = x^3 - 12x, the first derivative is 3x^2 - 12, with critical points at x=-2 and x=2, resulting in a maximum at x=-2 with a value of 16 and a minimum at x=2 with a value of -16.
- 🔢 For the function f(x) = 3x^4 - 8x^3 + 6x^2, the first derivative is 12x^3 - 24x^2 + 12x, and the critical points at x=0 and x=1 indicate a minimum at the origin (0,0).
- 📌 When creating a sign chart, test points should be chosen to the right and left of the critical numbers to determine the sign changes of the first derivative.
- 🌐 The multiplicity of a critical point (even or odd) affects the sign change of the first derivative across that point, which can simplify the sign chart analysis.
- 📝 The first derivative test is a valuable tool for understanding the behavior of functions, particularly in the context of optimization and finding local extrema.
Q & A
What is the main topic of the video?
-The main topic of the video is how to use the first derivative test to determine the relative extrema of a function.
What are the conditions for a function to have a relative minimum according to the first derivative test?
-According to the first derivative test, a function has a relative minimum if the first derivative changes from negative to positive.
What are the conditions for a function to have a relative maximum according to the first derivative test?
-According to the first derivative test, a function has a relative maximum if the first derivative changes from positive to negative.
How can you determine if a function has no relative maximum or minimum?
-If the sign of the first derivative does not change throughout the function, then there is no relative maximum or minimum.
What is the first step in using the first derivative test on a function?
-The first step in using the first derivative test is to find the first derivative of the function.
What is a critical number in the context of the first derivative test?
-A critical number is a value of x for which the first derivative is either zero or undefined.
How do you use a sign chart to determine the nature of a critical point?
-You create a sign chart by plotting the critical numbers on a number line and testing the sign of the first derivative at points around these critical numbers. The change in sign indicates whether the critical point is a relative minimum or maximum.
What is the process for finding the relative extrema of the function f(x) = x^2 - 4x + 5?
-First, find the first derivative, set it equal to zero to find the critical number, and then use a sign chart with test points to determine if it is a minimum or maximum. The relative minimum or maximum is found by plugging the critical number back into the original function.
What is the process for finding the relative extrema of the function f(x) = x^3 - 12x?
-Find the first derivative, set it equal to zero to find the critical points, and then use a sign chart to determine the nature of each critical point. The y-coordinates of the relative extrema are found by substituting the critical numbers back into the original function.
What is the role of the greatest common factor (GCF) in simplifying the first derivative?
-The GCF is used to simplify the first derivative by factoring out common terms, making it easier to set the derivative equal to zero and solve for critical numbers.
How does the multiplicity of a critical number affect the sign of the first derivative?
-If the multiplicity is even, the sign does not change across the critical number. If the multiplicity is odd, the sign changes across the critical number.
What is the significance of the first derivative test in calculus?
-The first derivative test is significant in calculus as it provides a method to determine the relative extrema (maxima and minima) of a function, which is crucial for understanding the function's behavior and for various applications in optimization problems.
Outlines
📈 Introduction to the First Derivative Test
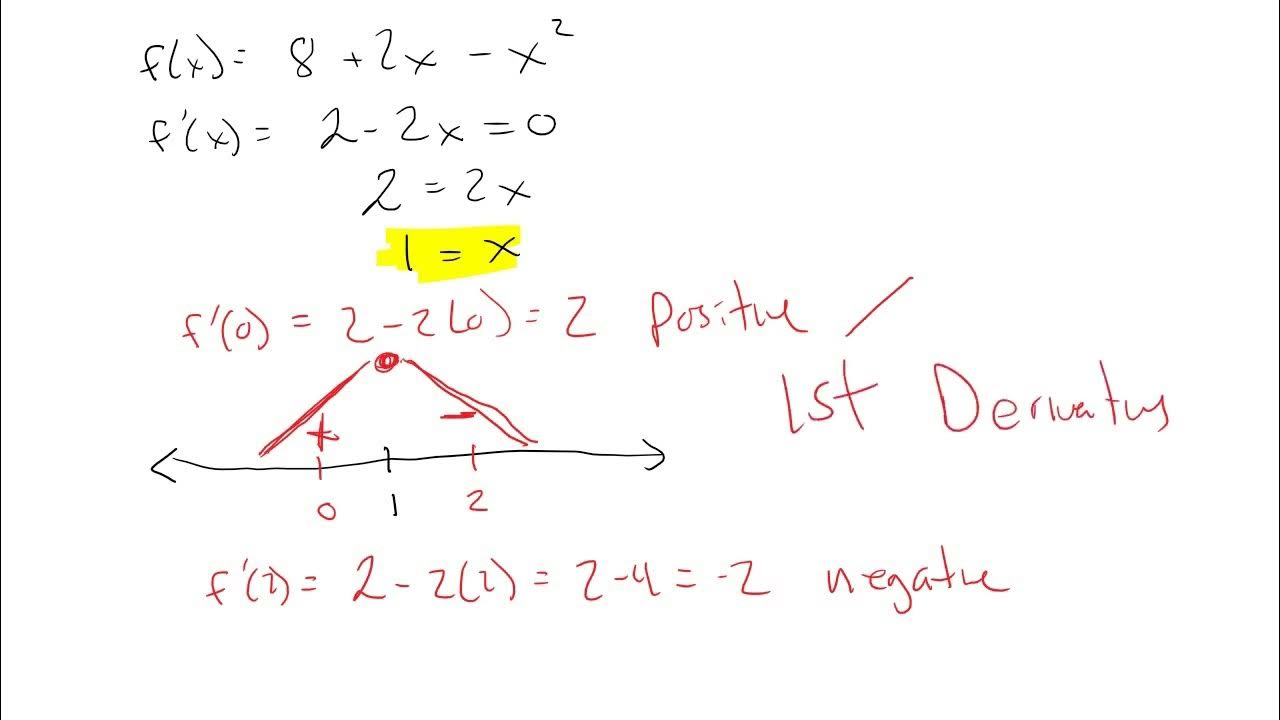
This paragraph introduces the concept of using the first derivative test to identify relative extrema of a function. It explains the difference between a relative minimum and a relative maximum by referring to graphical representations. The paragraph outlines the conditions for a minimum and maximum based on the sign change of the first derivative, emphasizing that a minimum occurs when the derivative changes from negative to positive, and a maximum when it changes from positive to negative. It sets the stage for the practical application of the first derivative test through example problems.
🧠 Application of the First Derivative Test on a Quadratic Function
In this paragraph, the first derivative test is applied to a specific quadratic function, f(x) = x^2 - 4x + 5. The process begins by finding the first derivative and setting it equal to zero to determine the critical points. A sign chart is then created to assess the behavior of the function around these critical points. The paragraph demonstrates that a relative minimum exists at x=2, with a value of 1, by plugging the critical number back into the original function. This example illustrates the step-by-step method of using the first derivative test to find the relative extrema of a quadratic function.
📊 Analysis of a Cubic Function's Relative Extrema
This paragraph continues the application of the first derivative test, this time on a cubic function, f(x) = x^3 - 12x. The first derivative is calculated, and critical points are identified by setting the derivative equal to zero. The sign chart is constructed to determine the nature of these critical points, leading to the identification of a relative maximum at x=-2 with a value of 16 and a relative minimum at x=2 with a value of -16. The summary highlights the process of determining the extrema and their values, reinforcing the method's effectiveness in analyzing cubic functions.
🔢 Examining the Relative Extrema of a Quartic Function
The final paragraph applies the first derivative test to a quartic function, f(x) = 3x^4 - 8x^3 + 6x^2. The first derivative is calculated, and the critical points are found by setting the derivative equal to zero. A sign chart is used to analyze the function's behavior around the critical numbers, x=0 and x=1. The paragraph concludes that there is a minimum at x=0, with the function value being zero, and no extremum at x=1 due to the even multiplicity not changing sign. This example demonstrates the application of the first derivative test to more complex functions and the importance of considering multiplicity in sign analysis.
Mindmap
Keywords
💡First Derivative Test
💡Relative Extrema
💡Critical Points
💡Sign Chart
💡Derivative
💡Monotonicity
💡Slope
💡Graphical Representation
💡Factoring
💡Greatest Common Factor (GCF)
💡Test Points
Highlights
The video discusses the use of the first derivative test to determine the relative extrema of a function.
A relative minimum is identified when the function changes from decreasing to increasing, and the first derivative changes from negative to positive.
A relative maximum occurs when the function changes from increasing to decreasing, and the first derivative changes from positive to negative.
The first graph demonstrates a relative minimum with the function decreasing before the minimum and increasing after it.
The second graph shows a relative maximum with the function increasing before the maximum and decreasing after it.
The third graph has no relative minimum or maximum as the function does not change its direction of monotonicity.
The function f(x) = x^2 - 4x + 5 is used as an example to apply the first derivative test.
The first derivative of the function is found to be f'(x) = 2x - 4.
By setting the first derivative equal to zero, a critical number x = 2 is found.
A sign chart is used to determine the nature of the critical number, indicating a relative minimum at x = 2.
The relative minimum value is found to be (x, y) = (2, 1) by plugging the critical number back into the function.
The function f(x) = x^3 - 12x is used as another example to find relative extrema.
The first derivative of this function is f'(x) = 3x^2 - 12.
Two critical numbers, x = -2 and x = 2, are found by setting the first derivative to zero.
A sign chart helps to identify a relative maximum at x = -2 and a relative minimum at x = 2.
The relative maximum value is (x, y) = (-2, 16) and the relative minimum value is (x, y) = (2, -16).
The function 3x^4 - 8x^3 + 6x^2 is analyzed for relative extrema in the final example.
The first derivative is calculated as f'(x) = 12x^3 - 24x^2 + 12x.
The critical numbers for this function are x = 0 and x = 1.
A sign chart and the multiplicity of the critical points are used to determine a minimum at x = 0 and no extremum at x = 1.
The minimum value at x = 0 is (0, 0), indicating the extremum is at the origin.
The video concludes by reinforcing the method of using the first derivative test to find the relative extrema of a function.
Transcripts
Browse More Related Video
The First Derivative Test
Finding Local Maximum and Minimum Values of a Function - Relative Extrema
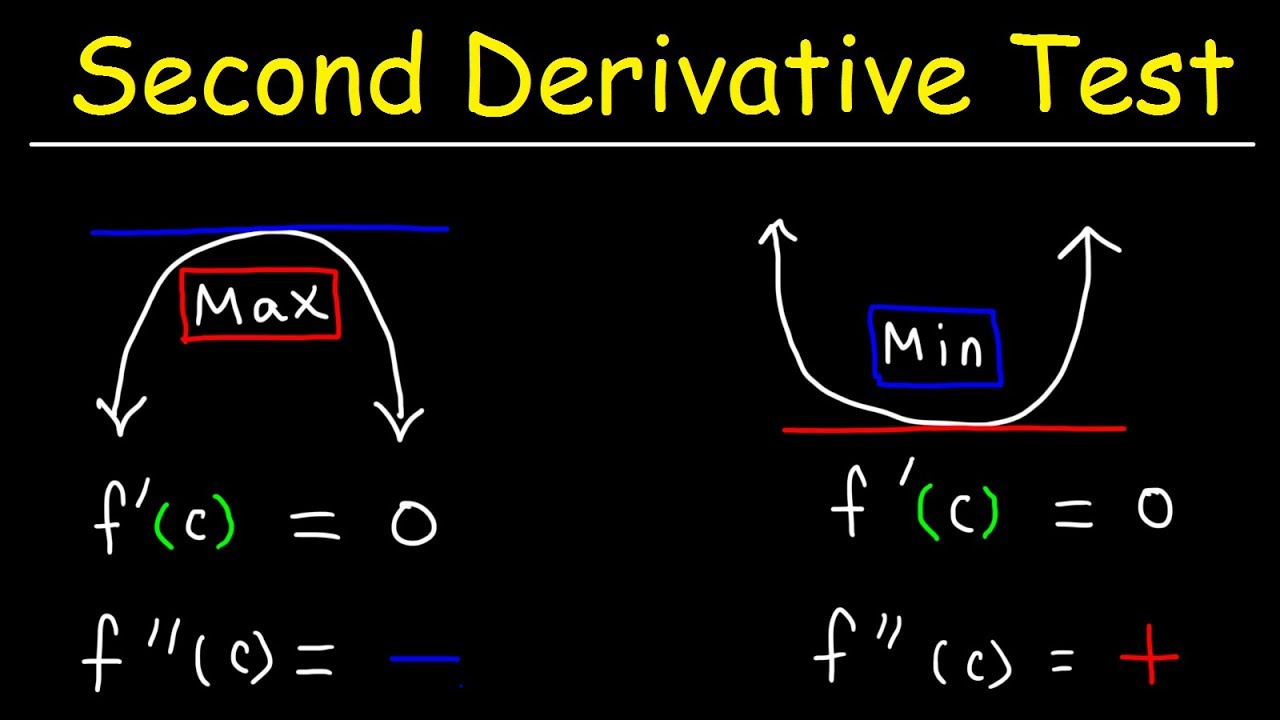
Second Derivative Test
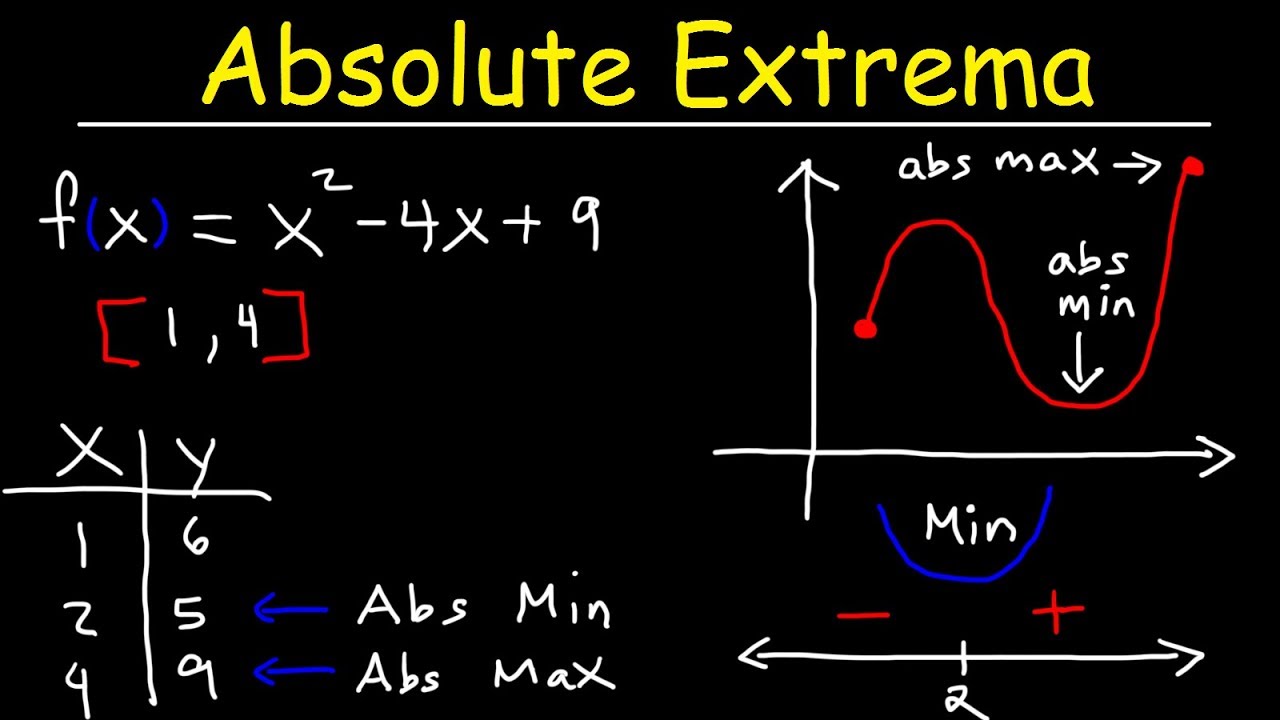
Finding Absolute Maximum and Minimum Values - Absolute Extrema

3.2 - Using Second Derivatives to Classify Max and Min Values

3.1 - Using First Derivatives to Classify Max and Min Values
5.0 / 5 (0 votes)
Thanks for rating: