Ap Physics Workbook 1.I The Chase
TLDRThe transcript discusses a physics problem involving a truck and a police car. The truck travels at a constant speed, while the police car begins accelerating from rest after the truck passes. The problem requires graphing the velocities of both vehicles and determining when they reach the same speed and location. The explanation involves understanding velocity-time graphs and calculating distances using the areas under the curves. The segment also addresses the concepts of constant acceleration and deceleration in relation to the shape of the velocity-position graphs.
Takeaways
- 🚚 The truck is traveling at a constant speed of 20 meters per second through a school zone.
- 🚓 At time T=0, the truck passes a hidden police car that is initially at rest.
- 🏃♂️ 5 seconds after the truck passes, the police car begins accelerating at a constant rate of 2 meters per second squared to catch the truck.
- 📈 The velocity graph of the truck is a flat line at 20 m/s, while the police car's velocity graph shows an upward slope representing its acceleration.
- 🎯 The point at which the truck and police car speeds are equal can be determined from the velocity graph, occurring around 15 seconds as per the rough estimation.
- 📊 The position of the police car and the truck can be compared by calculating the area under their respective velocity graphs.
- 🚀 The truck is ahead of the police car because it has a greater area under its velocity graph, indicating it has traveled a further distance.
- 🤔 To find when the truck and police car are at the same location, we look for the point where the areas under their velocity graphs are equal.
- 🔄 The graph of position versus time for the police car is curved due to its acceleration, unlike the velocity graph which is linear.
- ✅ Angelica's reasoning is correct that for a constant acceleration, both the velocity versus time and position versus time graphs should be curved.
- ⏰ Blake's observation that the police car's graph should start at 5 seconds due to the delay before it begins to move is accurate, indicating a horizontal shift in the graph.
Q & A
What is the initial speed of the truck?
-The truck is traveling at a constant speed of 20 meters per second at the beginning.
How long does it take for the police car to start accelerating after the truck passes?
-The police car begins accelerating 5 seconds after the truck passes.
What is the acceleration rate of the police car?
-The police car accelerates at a constant rate of 2 meters per second squared.
What is the significance of the velocity graph in understanding the motion of the truck and the police car?
-The velocity graph helps to visualize the speed of the truck and the police car over time, showing their constant and changing speeds respectively.
How can you determine when the truck and police car have the same speed?
-You can determine when they have the same speed by looking for the point where their velocity graphs intersect on the graph.
What does the area under the velocity graph represent?
-The area under the velocity graph represents the distance traveled by the vehicle.
How does the position of the police car compare to the truck when their speeds are equal?
-When their speeds are equal, the police car is behind the truck because the area under the truck's velocity graph is greater, indicating it has traveled a longer distance.
What is the relationship between the velocity graph and the position graph?
-The velocity graph shows the speed of the vehicle over time, while the position graph shows the distance traveled over time. The area under the velocity graph corresponds to the position on the position graph.
What is the shape of the velocity versus time graph for a vehicle with constant acceleration?
-For a vehicle with constant acceleration, the velocity versus time graph has a linear slope.
What is the shape of the position versus time graph for a vehicle with constant acceleration?
-For a vehicle with constant acceleration, the position versus time graph is curved.
How does a delay in the start of acceleration affect the velocity graph?
-A delay in the start of acceleration results in a horizontal shift of the velocity graph, with a flat line indicating no movement for the initial delay period.
Outlines
🚚 Velocity Graph Analysis of a Truck and Police Car
This paragraph discusses a physics problem involving a truck traveling at a constant speed of 20 m/s through a school zone and a police car that begins accelerating from rest at a rate of 2 m/s^2 after the truck passes. The main focus is on understanding the velocity graph, labeling it, and using it to determine when the truck and police car speeds become equal, which is found to be at approximately 15 seconds. The area under the velocity curve represents distance traveled, and the truck is ahead of the police car at the point where their velocities match.
📈 Position Graph and Distance Comparison
The second paragraph delves into the concept of using the velocity graph to determine the distance between the truck and the police car. It explains that the position can be found by calculating the area under the velocity curve, with the truck being ahead due to a greater area under its curve. The paragraph also addresses Angelica's reasoning about the need for a linear slope on the velocity vs. time graph for constant acceleration and a curved graph for the position vs. time graph, confirming her reasoning as correct.
⏱️ Time Delay in Police Car's Movement
This paragraph corrects a misconception about the representation of the police car's movement on the graph. It clarifies that the graph should show a flat line for the first five seconds, representing the delay before the police car starts moving, and then a curve that shows the car's acceleration. Blake's reasoning about the graph starting at 5 seconds instead of time zero is validated, emphasizing the importance of representing the time delay accurately on the graph.
Mindmap
Keywords
💡AP Physics
💡Constant Speed
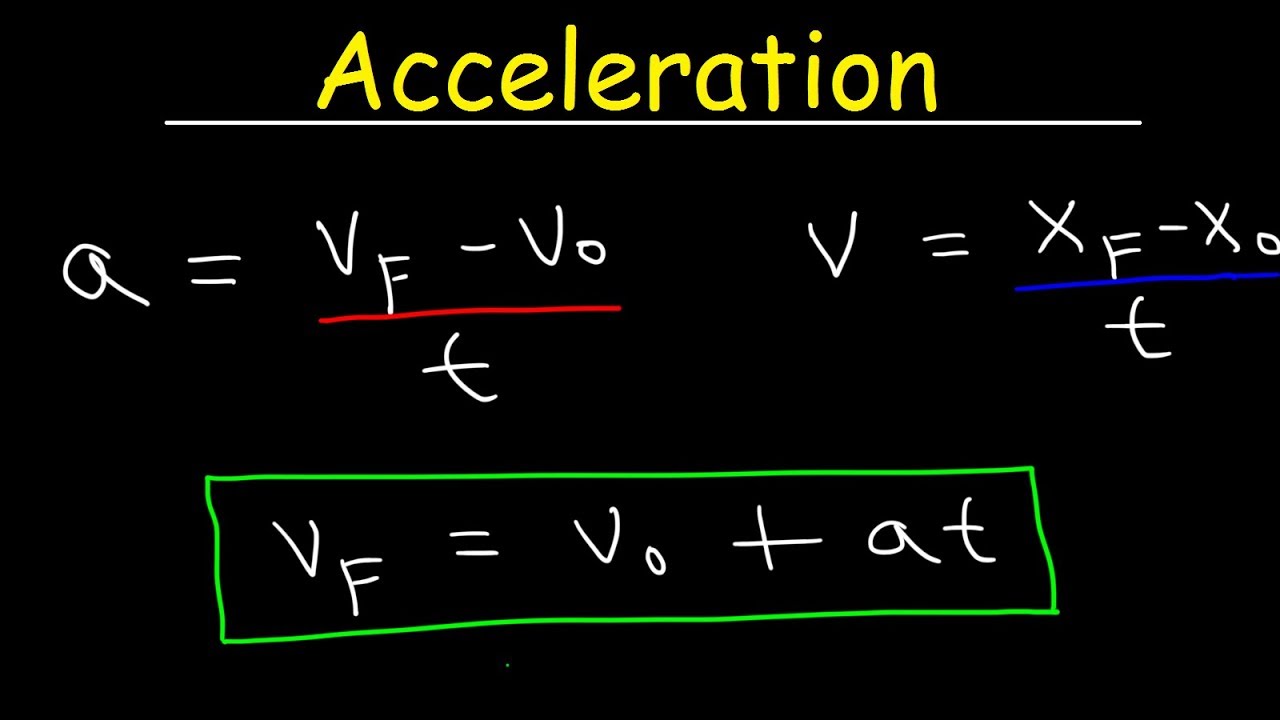
💡Acceleration
💡Velocity Graph
💡Intersection of Graphs
💡Area Under the Curve
💡Position vs. Time Graph
💡Constant Deceleration
💡Curved Graph
💡Horizontal Shift
Highlights
The scenario involves a truck traveling at a constant speed and a police car that begins accelerating from rest after the truck passes.
The truck's velocity is constant at 20 meters per second, represented as a flat line on the velocity graph.
The police car starts with zero velocity and accelerates at a rate of 2 meters per second squared.
The graph of the truck's velocity and the police car's velocity are to be labeled and possibly differentiated with colors or lines.
The velocity graph is essential for understanding the motion and the relative speed of the truck and the police car.
The police car's velocity graph shows a slope of 2 meters per second squared, indicating its acceleration.
The time at which the truck and police car speeds become equal can be determined from the velocity graph.
The area under the velocity graph represents the distance traveled, which can be used to compare the positions of the truck and police car.
The truck is ahead of the police car because it has covered more distance in the same time frame.
To find the time when the truck and police car are at the same location, the areas under their respective velocity graphs must be equal.
Angelica's reasoning about the need for a linear slope in the velocity graph for constant acceleration is correct.
A curved graph for position versus time indicates constant acceleration, which is true for the police car.
For a constant deceleration, the velocity graph must also be a curve, not a linear slope.
Blake's observation that the police car's graph should start at 5 seconds due to the delay is accurate.
The police car's graph should show no change in position for the first 5 seconds, represented as a flat line.
The police car's graph should be horizontally shifted to account for the delay in starting, not vertically.
The horizontal shift in the graph is due to the time delay in the police car's acceleration.
The velocity and position graphs provide a comprehensive understanding of the motion and relative positions of the truck and police car.
The practical application of these concepts can help in scenarios like traffic enforcement and vehicle dynamics analysis.
Transcripts
Browse More Related Video
5.0 / 5 (0 votes)
Thanks for rating: