HYPOTHESIS TESTING BASICS: Type 1/Type 2 errors | Statistical power
TLDRThe video script by Justin Zeltser delves into the critical concepts of Type 1 and Type 2 errors and statistical power in hypothesis testing. Using the analogy of a court case, it explains the null and alternate hypotheses, and how these errors relate to false positives and negatives. The script further explores the impact of sample size (n) and standard deviation (s) on the power of a test, emphasizing the importance of understanding these concepts for accurate statistical analysis.
Takeaways
- 📊 Type 1 and Type 2 errors are critical concepts in hypothesis testing, often misunderstood alongside the concept of statistical power.
- 🔍 Hypothesis testing involves null (default) and alternate hypotheses, where the null hypothesis assumes no effect or guilt, and the alternate seeks evidence for an effect or guilt.
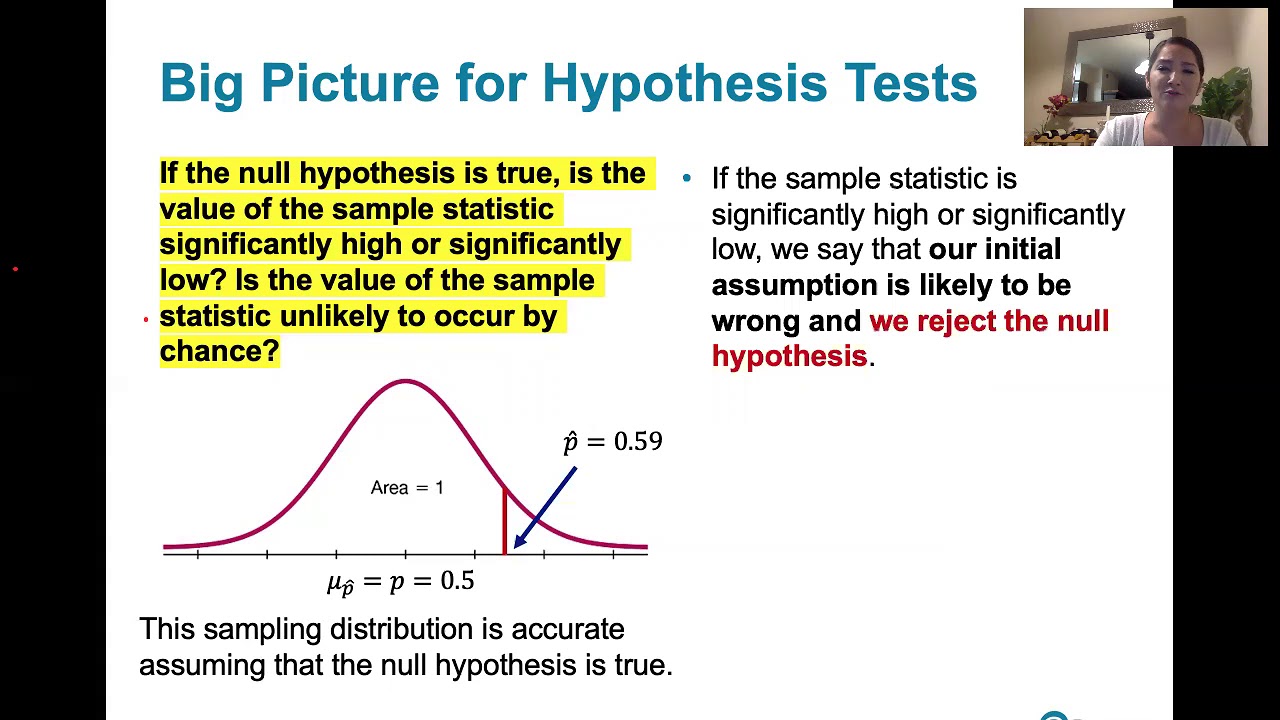
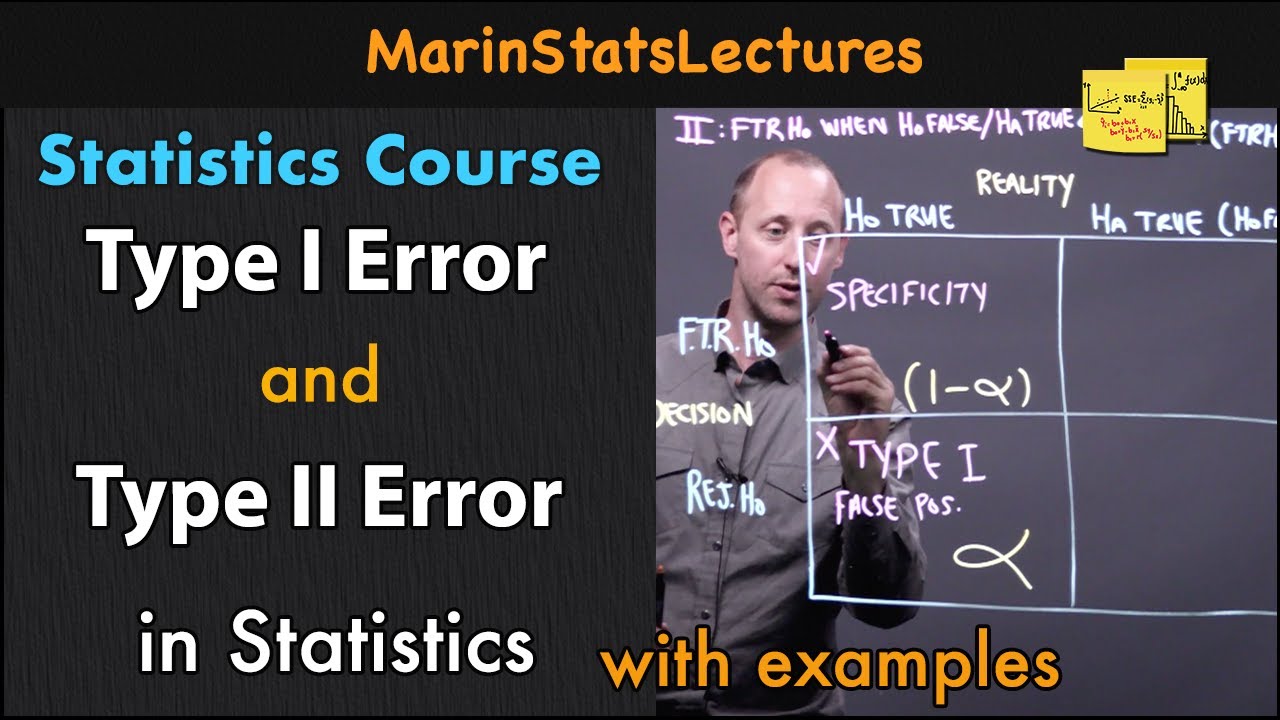
- ⚖️ Type 1 error (false positive) occurs when the null hypothesis is incorrectly rejected, represented by the Greek letter alpha, which is the significance level set for the test.
- 🔍 Type 2 error (false negative) happens when the null hypothesis is not rejected, even though the alternate hypothesis is true, represented by the Greek letter beta.
- 💪 Statistical power is the ability of a test to correctly reject a false null hypothesis, indicating the likelihood of correctly identifying an effect when it exists.
- 📈 The relationship between Type 1 and Type 2 errors and power is interconnected; as one changes, the others may be affected.
- 🔢 Increasing the standard deviation (s) of the sample increases uncertainty, leading to fatter curves and potentially decreased power.
- 📏 Increasing the sample size (n) leads to more precise estimates, resulting in skinnier curves and increased power.
- 🔄 The larger the true difference between groups (e.g., the effect of smoking cessation on lung function), the greater the power to detect that difference.
- 📚 Understanding these concepts is crucial for proper statistical analysis and interpretation, and they apply across various fields, including medical research and legal proceedings.
- 🎓 Justin Zeltser, the speaker, uses a courtroom analogy to explain hypothesis testing, making complex statistical concepts more relatable and easier to understand.
Q & A
What are Type 1 and Type 2 errors in the context of hypothesis testing?
-Type 1 error, also known as a false positive, occurs when the null hypothesis is incorrectly rejected, meaning that a difference or effect is declared when there is none. Type 2 error, or false negative, happens when the null hypothesis is not rejected when it should be, failing to detect an actual difference or effect.
What is the significance of the null hypothesis in hypothesis testing?
-The null hypothesis serves as the default starting point in hypothesis testing. It typically posits that there is no effect or difference being tested for. The goal is to gather evidence to either reject or fail to reject the null hypothesis. It is a conservative approach that avoids making false claims of effects or differences that do not actually exist.
How is the concept of 'statistical power' defined and what does it measure?
-Statistical power is the probability that a test will correctly reject a false null hypothesis, meaning it measures the likelihood of detecting an effect or difference when it truly exists. High power indicates a low chance of committing a Type 2 error.
What is the relationship between Type 1 and Type 2 errors in hypothesis testing?
-Type 1 and Type 2 errors are inversely related. Reducing the chance of a Type 1 error (false positive) often increases the chance of a Type 2 error (false negative), and vice versa. The balance between these errors is critical in hypothesis testing and is influenced by factors such as the significance level (alpha), the power of the test (1 - beta), and the sample size.
How does the level of significance (alpha) relate to the probability of committing a Type 1 error?
-The level of significance (alpha) is the probability of committing a Type 1 error. It is the threshold set by the researcher for deciding when to reject the null hypothesis. A lower alpha level means a stricter criterion for rejecting the null hypothesis, thus reducing the chance of a Type 1 error but potentially increasing the chance of a Type 2 error.
What is the role of the sample size (n) in determining the statistical power of a test?
-The sample size (n) has a direct impact on the statistical power of a test. As the sample size increases, the standard error of the estimate decreases, leading to narrower confidence intervals and a higher likelihood of detecting a true effect if it exists. Thus, larger sample sizes generally increase the power of a test.
How does the underlying standard deviation (s) of the sample affect statistical power?
-The underlying standard deviation (s) reflects the variability or dispersion in the sample data. Greater variability leads to wider confidence intervals and a lower statistical power, as the increased overlap between the distributions of the two groups (e.g., those who stopped smoking and those who continued) makes it harder to detect a significant difference.
What happens to the power of a test if the true difference (Delta) between groups increases?
-If the true difference (Delta) between the groups increases, the power of the test also increases. A larger effect size makes it easier for the test to detect a significant difference, thus reducing the likelihood of a Type 2 error.
Can you explain the concept of 'true negative' and 'true positive' in the context of hypothesis testing?
-In hypothesis testing, a 'true negative' occurs when the null hypothesis is correctly not rejected, meaning that there is no effect or difference as the null hypothesis posits. A 'true positive' happens when the null hypothesis is correctly rejected in favor of the alternative hypothesis, indicating that there is indeed an effect or difference.
How does the concept of hypothesis testing relate to a criminal trial?
-In a criminal trial, the null hypothesis is akin to the presumption of innocence. Prosecutors must gather enough evidence to reject this null hypothesis (prove guilt beyond a reasonable doubt). A 'true negative' corresponds to a 'not guilty' verdict for an innocent person, while a 'true positive' is a 'guilty' verdict for a person who actually committed the crime. Type 1 and Type 2 errors in this context would be a false conviction (Type 1) or failing to convict a guilty person (Type 2).
What are some practical examples of hypothesis testing in different fields?
-Hypothesis testing is widely used across various fields. In medicine, it might involve testing the effectiveness of an intervention or treatment. In diagnostics, it could be about testing for the presence of a disease. In regression analysis, it might be about determining the significance of particular variables. In comparing group means, it could be to see if two different treatments or groups have different outcomes on a measured variable.
Outlines
📊 Introduction to Type 1 and Type 2 Errors in Hypothesis Testing
This paragraph introduces the concepts of Type 1 and Type 2 errors, which are crucial in the study of hypothesis testing but often misunderstood. The video aims to clarify these concepts using a unique approach and a visual aid. The speaker, Justin Zeltser, shares his personal experience of understanding these concepts better through teaching and encourages viewers to follow along for a comprehensive understanding. The paragraph also briefly touches on the importance of statistical power in hypothesis testing.
🔍 Understanding Hypothesis Testing with Court Case Analogy
The speaker uses a court case analogy to explain hypothesis testing, drawing parallels between the legal concept of 'innocent until proven guilty' and the statistical null hypothesis. The paragraph outlines the four possible outcomes of a trial, which are then translated into the statistical context of Type 1 and Type 2 errors. The speaker emphasizes the conservative nature of hypothesis testing, where the default position is to maintain the null hypothesis unless there is sufficient evidence to support the alternate hypothesis. The concept of power is introduced as the likelihood of correctly convicting a guilty defendant in a criminal trial analogy, and it is explained that power is related to the probabilities of Type 1 and Type 2 errors.
🧠 Delving Deeper into Type 1 and Type 2 Errors with Examples
This paragraph expands on the concepts of Type 1 and Type 2 errors by providing examples from various fields such as medical interventions, diagnostic tests, regression analysis, and comparison of group means. The speaker explains how the null hypothesis typically represents no effect or difference, and the alternate hypothesis seeks to prove an effect or difference. The paragraph also discusses how sample results are used to assess the significance of the effect and how the same principles of false positives and false negatives apply in these scenarios. The speaker then transitions into a more detailed exploration of how the probabilities of Type 1 and Type 2 errors can be derived and how the power of a test can be understood.
🚬 Case Study: Smoking Cessation and Lung Function
The speaker presents a case study on smoking cessation and its effect on lung function to illustrate the application of hypothesis testing. The null and alternate hypotheses are defined, and the speaker explains how the test results are interpreted in relation to these hypotheses. The paragraph delves into the probabilities associated with Type 1 and Type 2 errors and the power of the test. The speaker uses visual aids to explain how the power of a test is affected by factors such as the standard deviation (s), the number of observations (n), and the magnitude of the true difference. The video ends with the speaker posing three questions to the viewers to test their understanding of the concepts discussed.
👋 Conclusion and Further Resources on Hypothesis Testing
In the concluding paragraph, the speaker thanks the viewers for their attention and provides a link to a playlist of hypothesis testing videos for further learning. The speaker also promotes his website, Zed Statistics, which offers a variety of statistical videos categorized for different levels of understanding. The paragraph serves as a wrap-up, encouraging viewers to explore more resources and continue their learning journey in statistics.
Mindmap
Keywords
💡Hypothesis Testing
💡Type 1 Error
💡Type 2 Error
💡Statistical Power
💡Null Hypothesis
💡Alternate Hypothesis
💡Level of Significance (Alpha)
💡Beta (Beta Error)
💡Sample Size (n)
💡Effect Size
💡Standard Deviation (s)
Highlights
The video discusses the critical concepts of Type 1 and Type 2 errors in hypothesis testing, aiming to clarify common misunderstandings.
Statistical power is introduced as an important aspect of hypothesis testing, influencing the ability to correctly reject a false null hypothesis.
The analogy of a court case is used to explain the concepts of null and alternate hypotheses, and the outcomes of a trial are related to hypothesis testing results.
Type 1 error is defined as incorrectly rejecting the null hypothesis, symbolized by the Greek letter alpha and also known as the level of significance.
Type 2 error is described as failing to reject the null hypothesis when it is false, represented by the Greek letter beta.
The relationship between beta and power is explained, where power is the probability of correctly convicting a guilty defendant.
The general hypothesis test is outlined, where the null hypothesis assumes no effect and the alternate hypothesis seeks evidence of an effect.
Examples from various fields such as medical interventions, diagnostic tests, and comparing group means are provided to illustrate the application of hypothesis testing.
The video emphasizes the conservative nature of hypothesis testing, starting with the assumption of no effect until proven otherwise.
The impact of sample size (n) on the power of a test is discussed, noting that more observations lead to more confident sample means and increased power.
The effect of the underlying standard deviation (s) on power is explained, where increased variation leads to decreased power due to greater overlap in the distribution curves.
The video provides a practical example of assessing whether smoking cessation improves lung function, setting up null and alternate hypotheses for this scenario.
The process of deriving probabilities for Type 1 and Type 2 errors and power is explored, offering insight into how these probabilities are calculated.
The video concludes with a set of questions for the viewer to ponder, encouraging deeper understanding of the concepts discussed.
Zed Statistics website is promoted as a resource for categorized statistical videos, aiming to support learning and curiosity in statistics.
The video aims to provide a comprehensive understanding of hypothesis testing, errors, and power, using engaging explanations and practical examples.
Transcripts
Browse More Related Video

How To Identify Type I and Type II Errors In Statistics

Statistical POWER and Power Analysis
8.1.2 Basics of Hypothesis Testing - Significance Level, Type I and Type II Error
Errors and Power in Hypothesis Testing | Statistics Tutorial #16 | MarinStatsLectures

Hypothesis testing (ALL YOU NEED TO KNOW!)
Type I error vs Type II error
5.0 / 5 (0 votes)
Thanks for rating: