What is a Sampling Distribution? | Puppet Master of Statistics
TLDRIn this informative video, Mike Maron explores the concept of a sampling distribution of the mean, crucial for statisticians to make precise population estimates from random samples. Using the analogy of estimating the average length of fish in a lake, Maron illustrates the process of collecting data, understanding sample behavior, and the importance of the standard error in estimating the population mean. The video simplifies complex statistical concepts, showing how even without knowing the entire population's true values, one can make educated guesses about it using the normal distribution of sample means.
Takeaways
- 📚 The video introduces the concept of a sampling distribution of the mean, a fundamental concept in statistical sciences.
- 🔍 The purpose of sampling is to estimate a population parameter, such as the mean, using a random sample.
- 🧐 The video raises the question of how we can trust a single sample to represent a larger population and ensure statistical precision.
- 🐟 The example used in the video is estimating the average length of fish in a lake, using a sample of 25 fish to represent the population.
- 📏 The true population mean and standard deviation are known through the help of 'Neptune', a hypothetical entity that knows the true values.
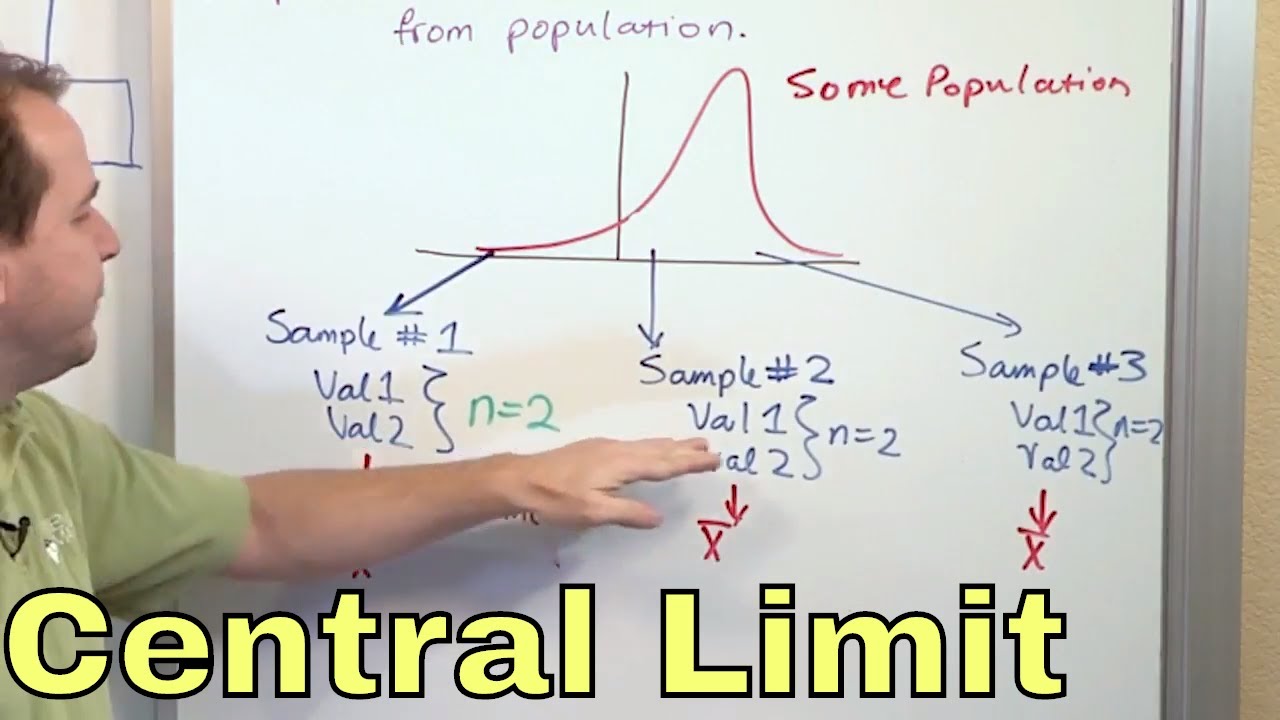
- 📊 A histogram of all possible sample means is discussed, illustrating the variability of sample means due to random sampling.
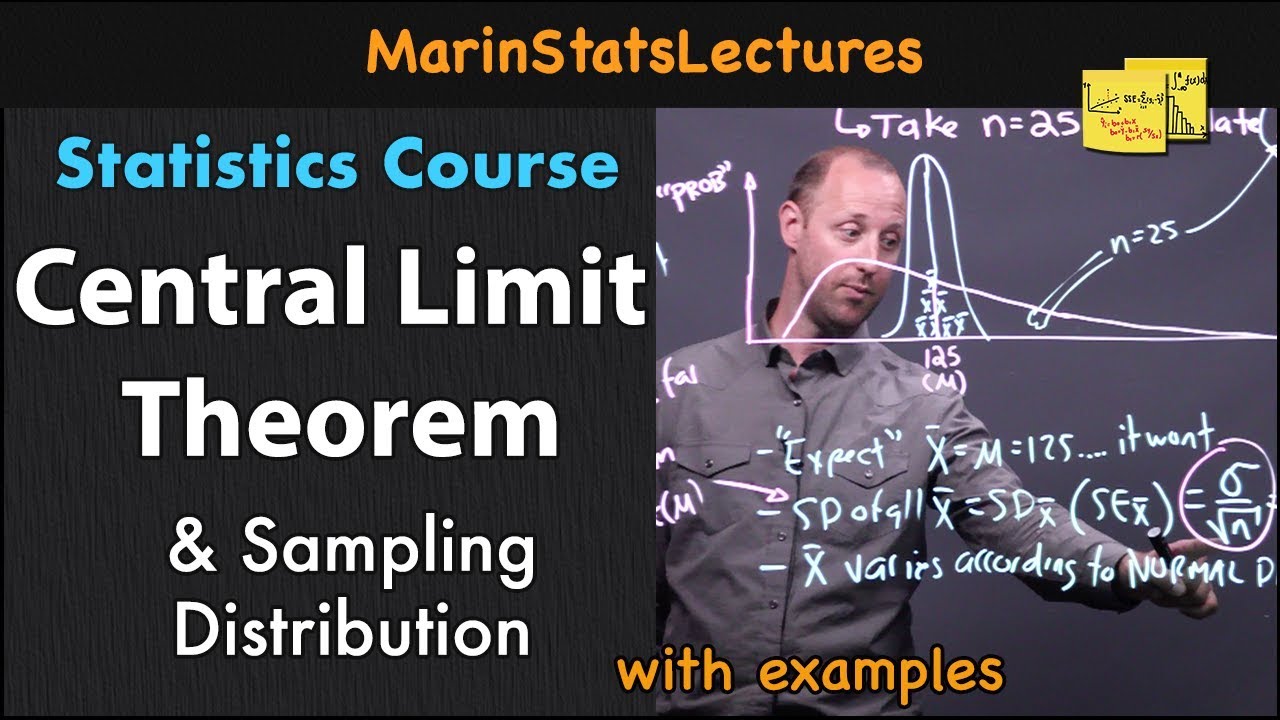
- 📉 The standard error is introduced as the standard deviation of all possible sample means, calculated as the population standard deviation divided by the square root of the sample size.
- 📚 The Central Limit Theorem is alluded to, stating that the sampling distribution of the mean will be approximately normally distributed if the sample size is large, regardless of the population distribution.
- 📐 The video explains that approximately 95% of sample means will fall within two standard errors of the true mean, providing a rule of thumb for estimation.
- 🔬 The importance of understanding sample behavior when true values are known is emphasized, as it helps build the theory needed for making statements about populations when true values are unknown.
- 📈 The video concludes by mentioning that the sampling distribution of the mean will be used in future videos to construct confidence intervals and perform hypothesis tests.
Q & A
What is the main concept discussed in the video script?
-The main concept discussed in the video script is the sampling distribution of the mean, which is crucial in statistical sciences for making inferences about a population based on a sample.
Why is it impractical to measure every single fish in a lake to determine the population mean?
-It is impractical because the population could be very large, potentially in the thousands, and measuring each fish would be time-consuming and resource-intensive.
What is the parameter that the video script aims to estimate?
-The parameter of interest is the population mean, specifically the mean length of fish in the lake.
What is the role of Neptune in the video script?
-Neptune is a fictional character who helps calculate the length of every single fish in the lake, providing the true mean and standard deviation of the fish lengths, which would be impossible to obtain in real life.
How does one build an understanding of how samples behave in statistics?
-One builds an understanding by using probability theory and by analyzing the behavior of samples when the true values for the entire population are known.
What is the term for the standard deviation of all possible sample means?
-The standard deviation of all possible sample means is called the standard error.
How is the standard error calculated?
-The standard error is calculated as the standard deviation of the individual observations divided by the square root of the sample size.
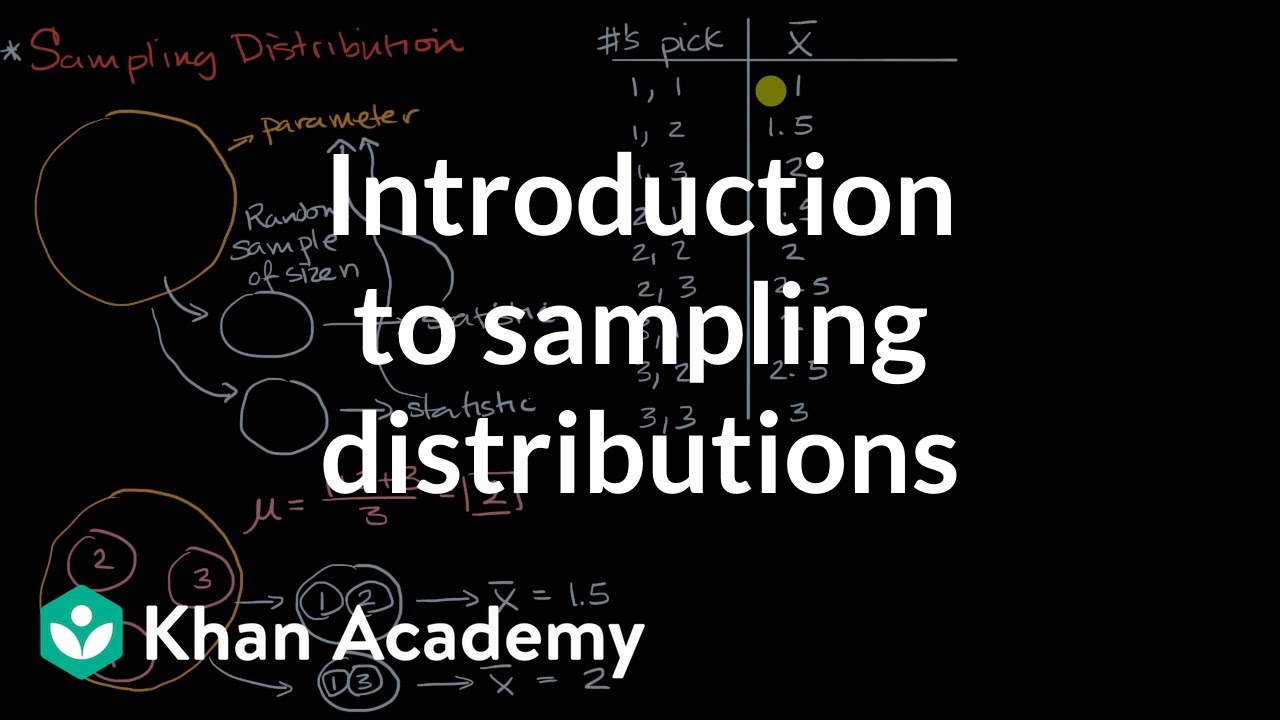
What does the sampling distribution of the mean represent?
-The sampling distribution of the mean represents the probability distribution of a sample mean based on a random sample, showing all possible estimates one could have ended up with.
Under what conditions is the sampling distribution of the mean approximately normally distributed?
-The sampling distribution of the mean is approximately normally distributed under certain conditions, such as having a large sample size, even if the population distribution is not normal.
What is the significance of the rule of thumb mentioned in the script regarding sample means?
-The rule of thumb signifies that approximately 95% of sample means will fall within about 2 standard errors of the true mean, providing a range within which most sample means are expected to lie.
How can the sampling distribution of the mean be used in real-world scenarios?
-In real-world scenarios, where the true values of the entire population are unknown, the sampling distribution of the mean can be used to construct confidence intervals and perform hypothesis tests to make statements about the population.
Outlines
📊 Understanding the Sampling Distribution of the Mean
In this paragraph, Mike Maron introduces the concept of a sampling distribution of the mean, which is essential in statistical sciences for making inferences about a population based on a sample. He uses the analogy of estimating the average length of fish in a lake to explain how one can use a single sample to make statements about an entire population. The importance of understanding the behavior of samples is emphasized, and the video aims to teach how to use probability theory to analyze samples and make informed estimates about the population mean. The video also introduces Neptune, a special friend, who helps in calculating the true mean and standard deviation of the fish lengths, illustrating the difference between knowing the true values and using statistical inference when such knowledge is not available.
🔍 The Role of Sampling Variability and Standard Error
This paragraph delves deeper into the concept of sampling variability and standard error, which are critical for understanding the potential deviation of a sample mean from the true population mean. Mike explains that even with the knowledge of the true mean and standard deviation of fish lengths in the lake, the sample mean from a random sample of 25 fish will not exactly match due to sampling variability. He introduces the standard error, which is calculated as the standard deviation of the individual fish lengths divided by the square root of the sample size, and illustrates how it predicts the typical deviation of the sample mean from the true mean. The paragraph also discusses the normal distribution of the sampling distribution of the mean under certain conditions, even if the population distribution is not normal, and introduces the rule of thumb that approximately 95% of sample means will fall within two standard errors of the true mean. The video concludes with the idea that understanding the behavior of samples when the true values are known allows for the development of statistical theory to make statements about populations when true values are unknown.
Mindmap
Keywords
💡Sampling Distribution
💡Mean
💡Estimate
💡Population Mean
💡Sample Mean
💡Standard Deviation
💡Standard Error
💡Sampling Variability
💡Normal Distribution
💡Confidence Interval
💡Hypothesis Test
Highlights
Introduction to the concept of a sampling distribution of the mean.
Importance of sampling distribution in statistical sciences.
Explanation of how data is collected and used to estimate population parameters.
Discussion on the variability of sample means with different random samples.
Use of probability theory to understand sample behavior when the true population values are known.
Introduction of Neptune to calculate the true population mean of all fish in the lake.
True population mean of the fish in the lake is 40 centimeters with a standard deviation of 10 centimeters.
Calculation of the sample mean from a random sample of 25 fish.
Explanation of sampling variability and its impact on the sample mean.
Definition and calculation of the standard error.
Explanation of how the standard error helps understand the deviation of the sample mean from the true mean.
Description of the sampling distribution of the mean as approximately normally distributed under certain conditions.
Discussion on the rule of thumb that 95% of sample means will fall within about 2 standard errors of the true mean.
Importance of understanding sample behavior to make statements about the population in real-world scenarios.
Introduction to the upcoming topics of constructing confidence intervals and testing claims using hypothesis tests.
Transcripts
Browse More Related Video
02 - What is the Central Limit Theorem in Statistics? - Part 1

What is a Confidence Interval? | Puppet Master of Statistics
Sampling Distributions: Introduction to the Concept
Introduction to sampling distributions | Sampling distributions | AP Statistics | Khan Academy
Confidence Interval Concept Explained | Statistics Tutorial #7 | MarinStatsLectures
Central Limit Theorem & Sampling Distribution Concepts | Statistics Tutorial | MarinStatsLectures
5.0 / 5 (0 votes)
Thanks for rating: