Finding Probability of a Sampling Distribution of Means Example 1
TLDRThe video script explains the application of the Central Limit Theorem in the context of sampling distributions, using an example involving the mean salary of plumbers. It details the process of calculating the probability that the mean salary of a sample exceeds a certain value, emphasizing the use of z-scores and the normal distribution curve. The explanation includes the formula for z-score in the context of sample means, the concept of standard error, and the step-by-step calculation leading to the conclusion that there's a 99.9% chance the mean salary in a sample of 42 plumbers is greater than $44,000.
Takeaways
- 📚 The central limit theorem is applicable for sampling distributions and is used to find probabilities related to sample means or proportions.
- 🧠 Understanding of sampling distribution is essential, which can be enhanced by watching previous educational videos on the topic.
- 💰 The example given involves determining the probability that the mean salary of a sample of plumbers exceeds $44,000, with a population mean salary of $46,700 and a population standard deviation of $5,600.
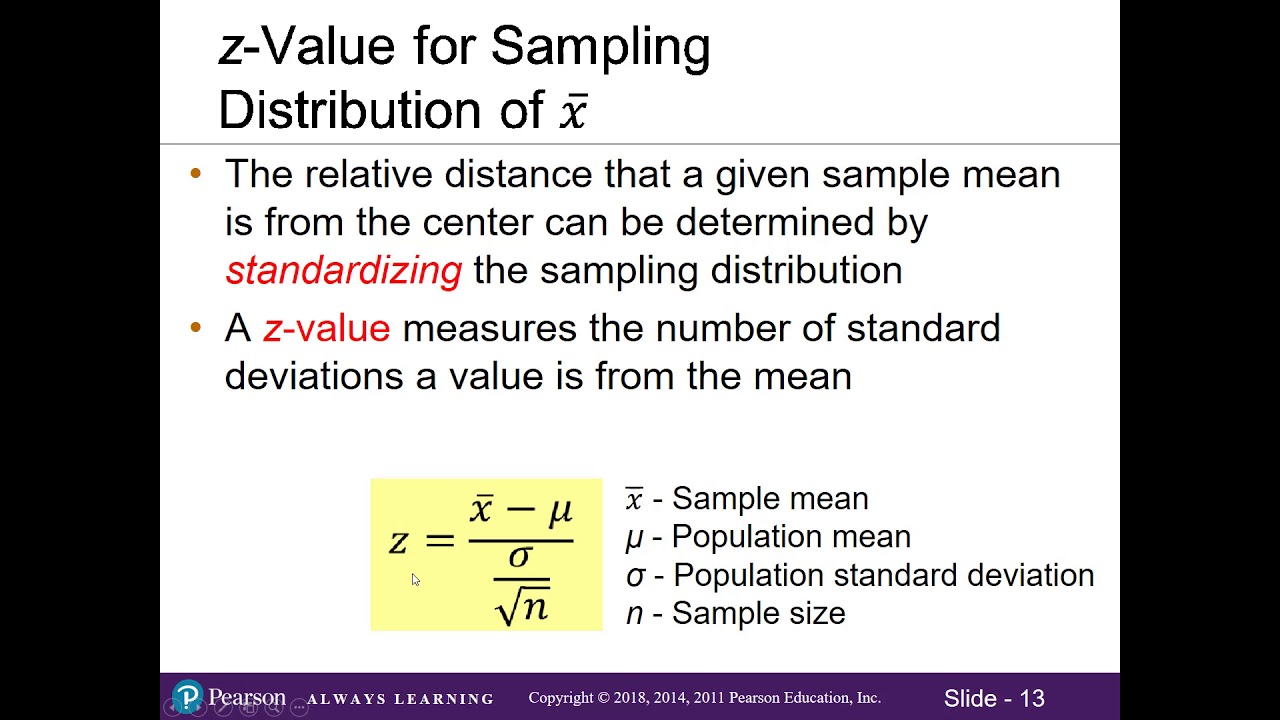
- 🔢 The z-score formula for a sampling distribution of means is X-bar - mu divided by the standard error (sigma/sqrt(n)), where X-bar is the sample mean.
- ⏳ The standard error is a key concept, representing the standard deviation of the sampling distribution and is used to calculate the z-score.
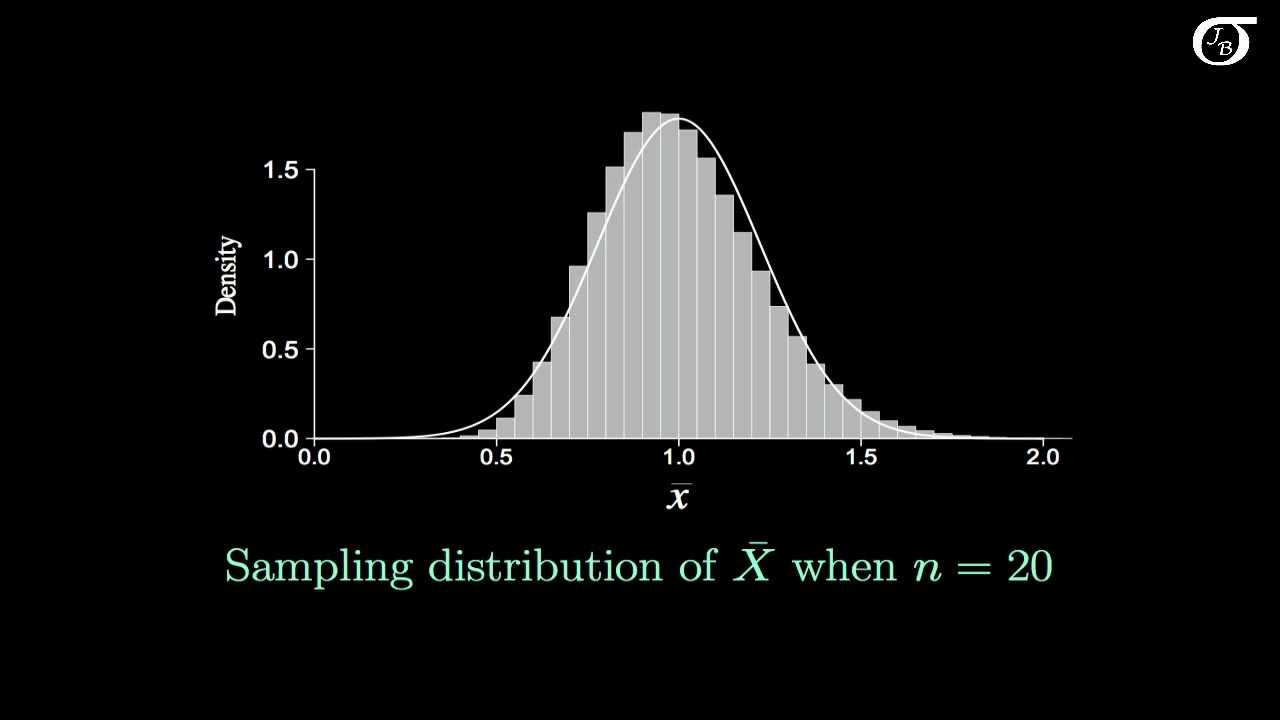
- 📈 The sampling distribution, when following a normal model, takes on a bell-shaped and symmetric curve, allowing the use of the normal curve to find probabilities.
- 🔍 The mean of the sampling distribution is equal to the population mean, a crucial property to remember when working with sample data.
- 🧮 Calculation of the z-score in the example results in -3.12, which indicates the number of standard deviations the sample mean is from the population mean.
- 🎯 To find the probability of the mean salary being greater than $44,000, the focus is on the area above the z-score in the normal distribution.
- 📊 Using a calculator's normalcdf function with the calculated z-score and an upper boundary of positive infinity yields a probability of 0.999.
- 🗣️ The final interpretation is that there is approximately a 99.9% chance that the mean salary of a sample will exceed $44,000, given the parameters of the population distribution.
Q & A
What is the central limit theorem used for?
-The central limit theorem is used for understanding the sampling distributions. It helps in determining the probability of sample means falling within a certain range, assuming the population follows a normal distribution.
What is a sampling distribution?
-A sampling distribution is a probability distribution of a given statistic based on a random sample of a certain size from a population. It shows how the sample statistic might vary from sample to sample.
How is the population mean annual salary of plumbers related to the sampling distribution?
-The population mean annual salary of plumbers is used as a reference point in the sampling distribution. It is the mean of the distribution from which samples are drawn, and it remains constant regardless of the sample size.
What is the given population standard deviation in the example?
-The given population standard deviation in the example is $5,600. This value is used in the calculation of the standard error and the z-score for the sampling distribution of means.
How is the z-score calculated for a sampling distribution of means?
-The z-score for a sampling distribution of means is calculated using the formula: (X - μ) / (σ / √n), where X is the sample mean, μ is the population mean, σ is the population standard deviation, and n is the sample size.
What does the standard error represent in the context of the sampling distribution?
-The standard error represents the standard deviation of the sampling distribution. It measures how much the sample mean is expected to vary from the actual population mean. It decreases as the sample size increases, indicating more precise estimates of the population mean.
What is the significance of the z-score in the example?
-The z-score in the example (-3.12) indicates how many standard errors the sample mean of $44,000 is below the population mean of $46,700. Negative z-scores suggest that the sample mean is less than the population mean, while positive z-scores would indicate the opposite.
How is the probability of the mean salary being greater than $44,000 determined?
-The probability is determined by finding the area under the standard normal curve above the z-score corresponding to a sample mean of $44,000. This is done using the normal cumulative distribution function (NORM.CDF) in statistical software or a calculator.
What is the final probability calculated in the example?
-The final probability calculated in the example is approximately 99.9%. This means there is a 99.9% chance that the mean salary of a sample of 42 plumbers will be greater than $44,000.
How does the central limit theorem apply to the example with the plumbers' salaries?
-The central limit theorem is applied to the example by assuming that the sampling distribution of the mean salary of plumbers follows a normal distribution, despite the population distribution being unknown. This allows for the use of z-scores and normal distribution properties to estimate probabilities.
What is the practical implication of the calculated probability in the context of the video?
-The calculated probability provides insight into the likelihood of observing a sample mean salary higher than $44,000 when drawing a random sample of 42 plumbers from the population. This can be useful for making inferences and decisions in various contexts, such as budgeting, compensation planning, or policy making.
Outlines
📊 Introduction to Central Limit Theorem and Sampling Distributions
The paragraph introduces the concept of the Central Limit Theorem and its application to sampling distributions. It emphasizes the importance of understanding what a sampling distribution is and suggests referring to previous videos for a clearer explanation. The speaker presents an example scenario involving the mean annual salary of plumbers and a random sample of 42 plumbers. The task is to find the probability that the mean salary of this sample exceeds $44,000, given a population standard deviation of $5,600. The speaker explains that this involves dealing with a sampling distribution and using the Central Limit Theorem, which will be applied through a z-score formula tailored for sample means. The paragraph also touches on the properties of sampling distributions, such as their bell-shaped and symmetric nature, allowing the use of the normal curve to find probabilities.
🧮 Calculation of Probability Using Z-Score and Central Limit Theorem
This paragraph delves into the calculation process using the z-score formula for the sampling distribution of means. The speaker defines the variables involved, including the population mean, the sample mean of $44,000, the population standard deviation, and the sample size of 42. The z-score is calculated by subtracting the population mean from the sample mean and dividing by the standard error, which is the population standard deviation divided by the square root of the sample size. The resulting z-score is negative 3.1 (rounded to -3.12 for simplicity). The speaker then explains how to use this z-score to find the probability that the mean salary is greater than $44,000. By using the normal cumulative distribution function (normalcdf), the speaker finds that the area above a z-score of -3.12 is 0.999, indicating a 99.9% probability that the mean salary of the sample will exceed $44,000. The speaker concludes by reiterating the process and the final answer, emphasizing the practical application of the Central Limit Theorem in solving such problems.
Mindmap
Keywords
💡Central Limit Theorem
💡Sampling Distribution
💡Population Mean
💡Sample Mean
💡Standard Deviation
💡Z-Score
💡Standard Error
💡Probability
💡Normal Distribution
💡Area Under the Curve
Highlights
The video discusses the application of the Central Limit Theorem in the context of sampling distributions.
The Central Limit Theorem is relevant for understanding the distribution of sample means.
A sampling distribution is a probability distribution of a sample statistic.
The video provides an example involving the mean annual salary of plumbers.
The population mean annual salary for plumbers is given as $46,700.
A random sample of 42 plumbers is drawn for the example.
The population standard deviation is provided as $5,600.
The video explains the concept of a z-score in the context of a sampling distribution.
The z-score formula for a sampling distribution of means is introduced and explained.
The properties of a sampling distribution are discussed, noting its bell-shaped and symmetric curve.
The mean of the sampling distribution is equal to the population mean, a key property.
The standard error is defined as the standard deviation of the sampling distribution.
The calculation of the z-score for the given example is demonstrated step by step.
The video shows how to use the normal curve to find the probability using the z-score.
The final probability that the mean salary of the sample is greater than $44,000 is found to be approximately 99.9%.
The video emphasizes the practical application of the Central Limit Theorem in statistical analysis.
Transcripts
Browse More Related Video
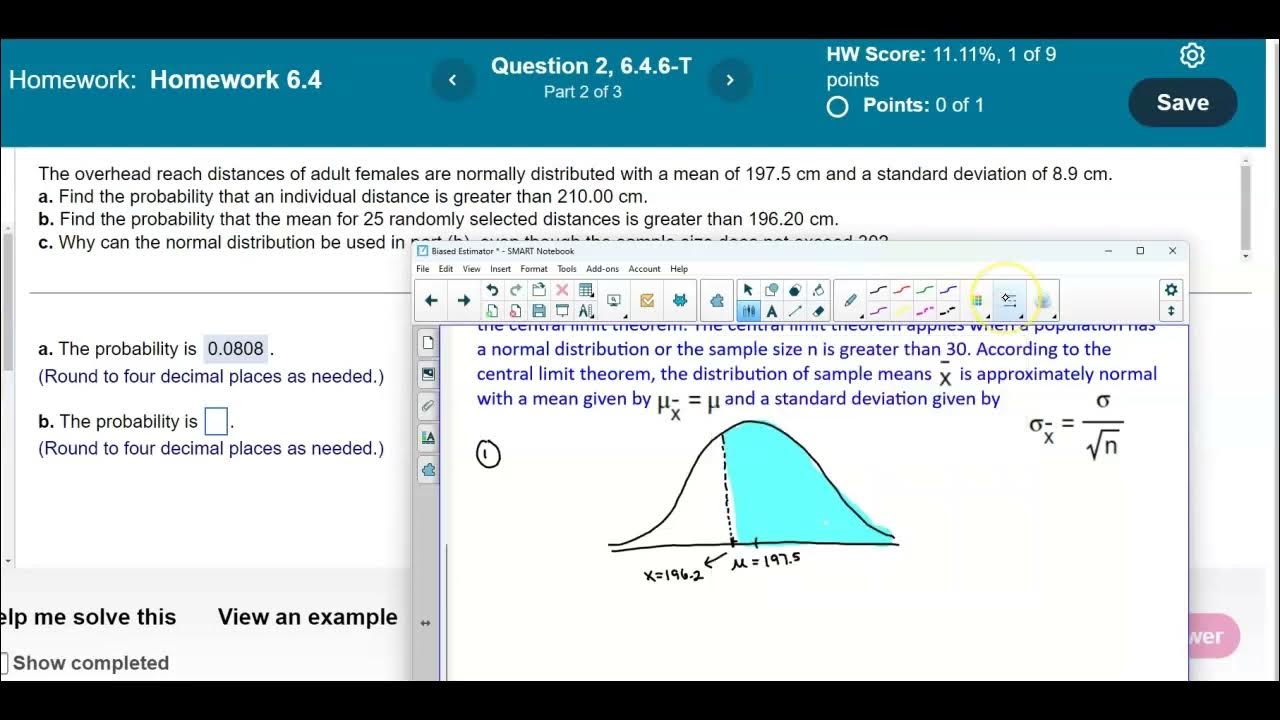
Math 14 HW 6.4.6-T Using the Central Limit Theorem
Introduction to the Central Limit Theorem
7.2 Sampling Distribution of the Mean (Updated)
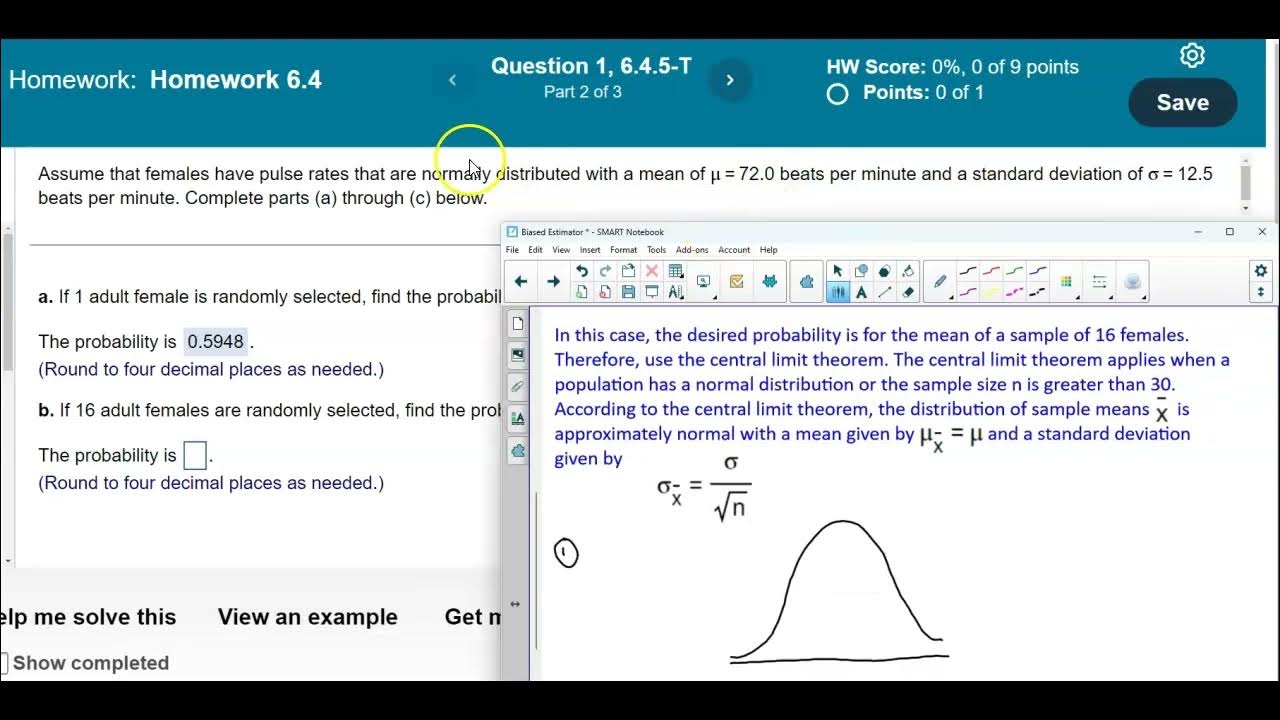
Math 14 HW 6.4.5-T Using the Central Limit Theorem

Elementary Stats Lesson #13
7.2.5 Estimating a Population Mean - Confidence Intervals with Known Pop. Standard Deviation
5.0 / 5 (0 votes)
Thanks for rating: