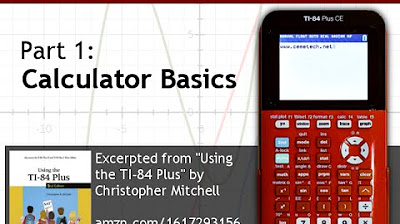
Using Your TI-84 Plus CE Part 2: Basic Graphing
TLDRIn this video, Christopher Mitchell, author of 'Using the TI-84 Plus, Second Edition,' demonstrates how to use the TI-84 Plus CE calculator for basic graphing in function mode. The tutorial covers accessing graph tools, entering and graphing equations, adjusting graph settings, and troubleshooting common issues. Mitchell also provides tips on formatting graphs and exploring intersections, along with troubleshooting tips. The video aims to equip viewers with essential graphing skills using the TI-84 Plus CE, making it a valuable resource for learners.
Takeaways
- 📚 The video is a tutorial on using the TI-84 Plus CE calculator for graphing in function mode, as part of a series by Christopher Mitchell, author of 'Using the TI-84 Plus' second edition.
- 🔢 The TI-84 Plus CE calculator can be used for basic math operations, including arithmetic, square roots, trigonometry, and graphing functions.
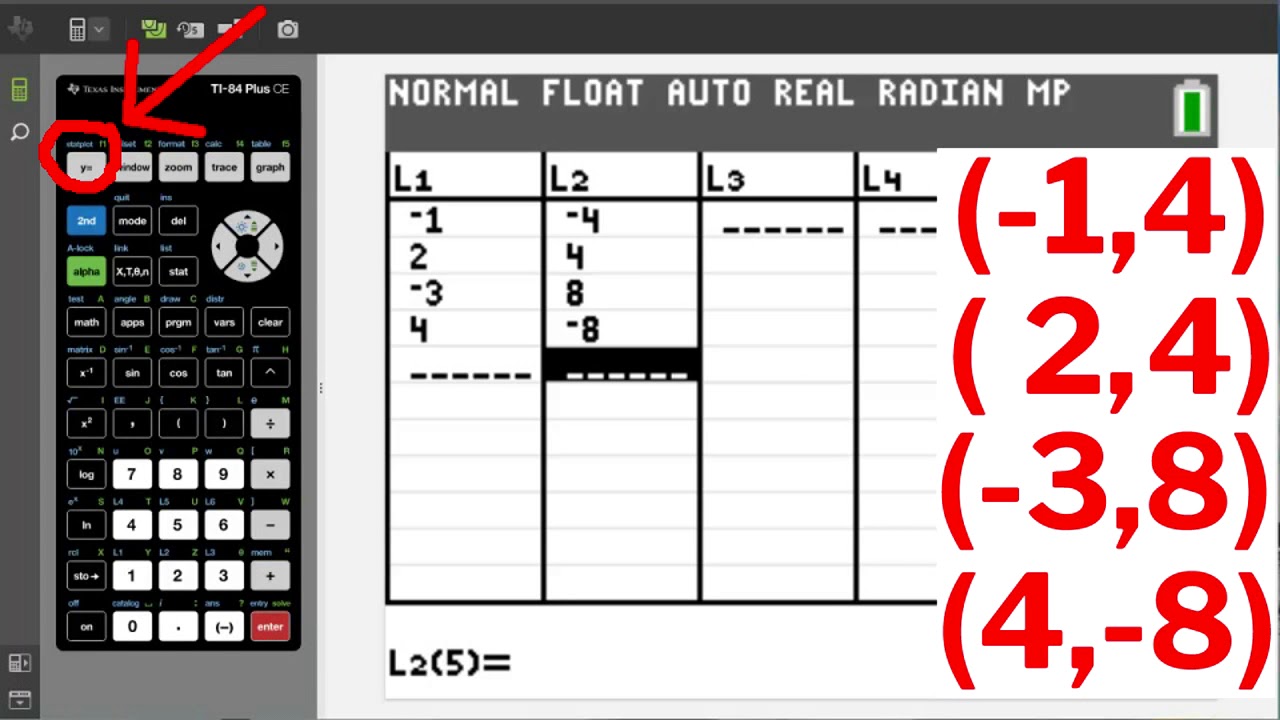
- 📈 To access graphing tools, you use the 'Y=' key and navigate through the menu to enter equations, change graph bounds, zoom, and trace points on the graph.
- 🎛️ The 'Function' mode must be enabled for graphing, which can be checked and selected using the 'Mode' key.
- 📉 The first equation demonstrated is 'Y1 = X', which graphs a line with a slope of 1, passing through the origin.
- 🔍 The 'Trace' function allows you to examine specific points on the graph, displaying the coordinates as you move the cursor.
- 🔄 You can enter multiple equations (e.g., 'Y2 = X^2 + 3X + 1') and switch between their graphs using the up and down arrows.
- 🤔 The 'Calculate' tool helps find characteristics of the graph, such as intersections, zeros, minimums, maximums, and derivatives.
- 🛠️ The 'Format' option lets you customize the graph's appearance, including grid lines, coordinate display, and axis colors.
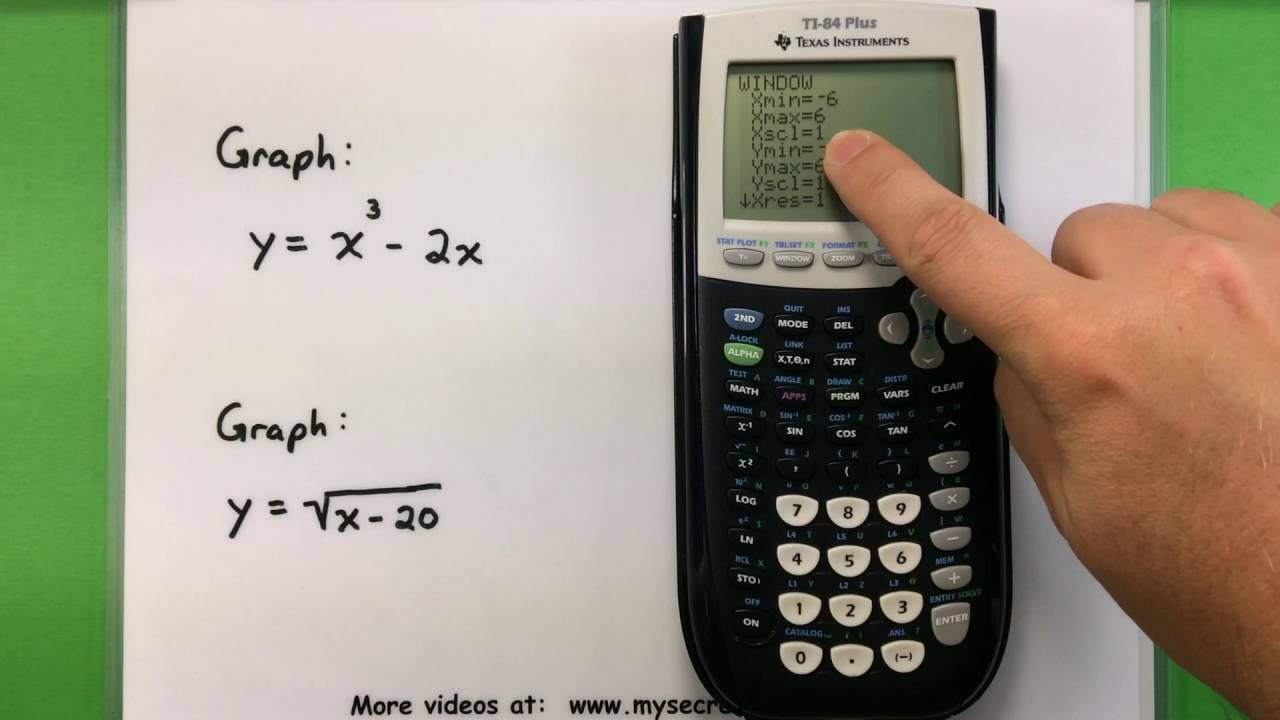
- 🔧 The 'Window' settings can be adjusted to focus on specific areas of the graph, by setting the minimum and maximum bounds for X and Y axes, and the scale.
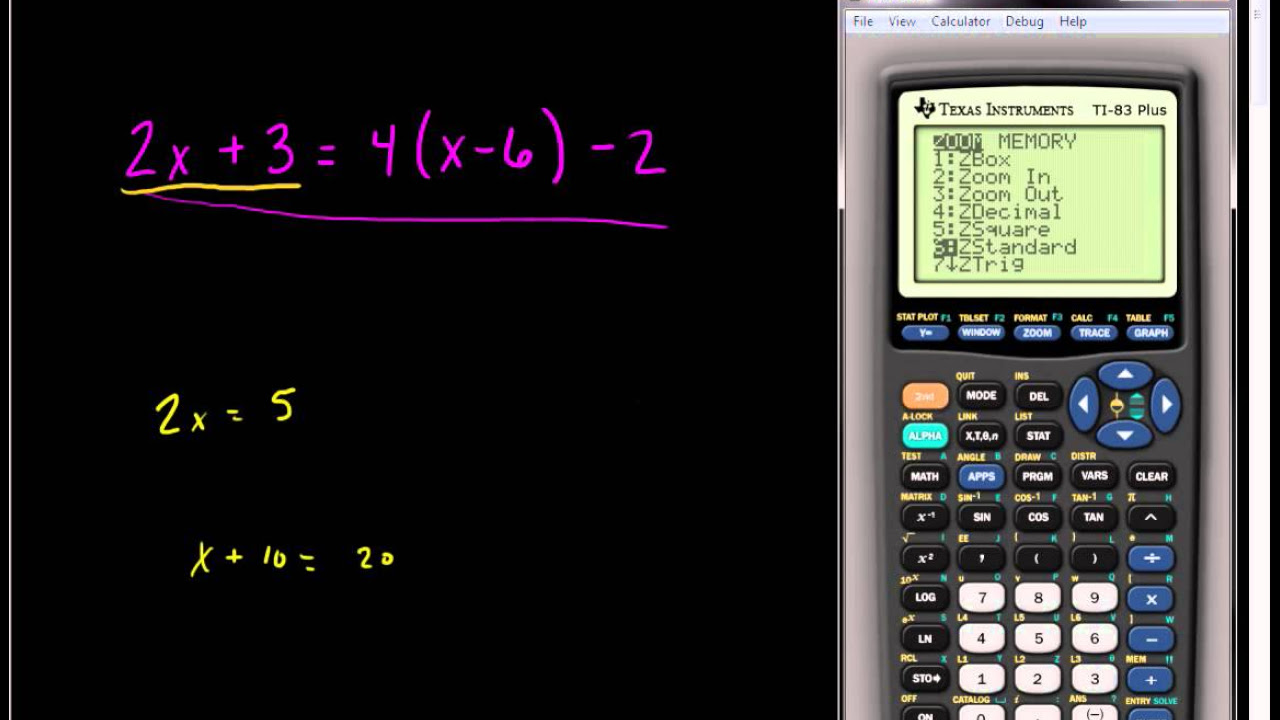
- 🔄 The 'Zoom' function offers various ways to view the graph, including zooming in/out and resetting to the standard view.
- ❗ Troubleshooting tips are provided for common issues like 'invalid dimension' errors, which occur when graphing is attempted without proper setup.
- 📘 The video concludes with a recommendation to purchase 'Using the TI-84 Plus' second edition for more in-depth information on graphing and calculator functions.
Q & A
What is the main topic of the video series?
-The main topic of the video series is teaching viewers how to use the TI-84 Plus CE calculator for basic math and graphing functions.
Which key on the TI-84 Plus CE calculator is used to access the graph tools?
-The 'Y=' key is used to access the graph tools on the TI-84 Plus CE calculator.
What does the 'Window' option allow you to do on the calculator?
-The 'Window' option allows you to change the bounds of the screen and adjust the zoom settings on the calculator.
How do you enter the independent variable 'X' in function mode on the TI-84 Plus CE calculator?
-You enter the independent variable 'X' by pressing the 'X,T,θ,N' key directly under 'MODE' in function mode.
What happens when you press the 'Graph' key on the calculator?
-Pressing the 'Graph' key displays a graph of all the equations that you have entered.
How can you find the intersection point of two graphs on the calculator?
-You can find the intersection point of two graphs using the 'Calculate' tool and selecting the 'Intersect' option.
What does the 'Trace' function show on the graph?
-The 'Trace' function shows a flashing cursor on the line along with the x and y coordinates of the cursor at the bottom of the screen.
How can you change the format of the graph on the calculator?
-You can change the format of the graph by pressing '2nd' and then 'Zoom' to access options such as rectangular or polar coordinate display, grid lines, and axis colors.
What is the purpose of the 'Window' settings in graphing?
-The 'Window' settings allow you to set the minimum and maximum bounds for the x and y axes and adjust the scale of the tick marks to focus on specific areas of the graph.
How do you reset the graph to the default zoom settings on the calculator?
-You can reset the graph to the default zoom settings by selecting 'ZoomStandard' in the 'Zoom' menu.
What should you do if you encounter an 'Invalid Dimension' error while trying to graph a function?
-If you encounter an 'Invalid Dimension' error, you should check if any plot settings are enabled and disable them by pressing 'ENTER' when the plot option is highlighted in white text on a black background.
What additional tools are available for graph manipulation and analysis on the TI-84 Plus CE calculator?
-Additional tools include the 'Table' for examining function values at various points, 'Style' options for changing line colors and types, and various 'Zoom' functions for different viewing perspectives.
Outlines
📊 Introduction to Graphing with TI-84 Plus
Christopher Mitchell welcomes viewers to a series on using the TI-84 Plus calculator. This part covers basic graphing in function mode. He explains how to access graph tools using the top five keys on the calculator, including the Y= key for entering equations, the Window key for setting graph bounds, and others. Viewers learn to graph their first equation, Y=X, using these tools. Mitchell demonstrates entering and graphing a simple linear equation and then finding the intersection of two graphs using the calculator's calculate tools.
🖌️ Formatting and Troubleshooting Graphs
The video continues with a focus on formatting and customizing the graph display. Mitchell shows how to display a grid behind the graph and change the color of the axes. He then demonstrates zooming in on the graph, setting custom bounds to focus on specific graph areas, and troubleshooting common errors like the 'invalid dimension' error. Mitchell also covers using the table feature to view coordinates and changing line styles for better graph visualization.
🚄 Practical Applications and Additional Features
In the final part, Mitchell outlines the practical applications and additional features of the TI-84 Plus calculator. He mentions scenarios like calculating the trajectory of a ball or determining the meeting point of two trains. The video also touches on more advanced zoom functions, graph manipulation, and formatting options, such as adding grids and changing axis labels. Mitchell encourages viewers to read his book for more comprehensive guidance and examples.
Mindmap
Keywords
💡TI-84 Plus CE
💡Graphing
💡Function Mode
💡Y-Equals Key
💡Trigonometry
💡Trace
💡Intersection
💡Zoom
💡Window
💡Format
💡Plot
Highlights
Introduction to the video series on using the TI-84 Plus CE calculator for basic graphing.
Explanation of how to access graph tools on the TI-84 Plus CE calculator.
Guidance on entering equations to graph in function mode.
Instructions on how to enable function mode for graphing.
Demonstration of graphing the simple equation y=x.
Using the trace function to examine points on the graph.
Switching between different graphs using the up and down arrows.
Entering a second equation to graph a parabola.
Observing the intersection of two graphs and finding the point of intersection.
Using the calculate tool to find characteristics of the graph, such as intersections.
Changing the format of the graph, including grid display and axis colors.
Adjusting the window settings to focus on a specific area of the graph.
Zooming in and out on the graph for a closer or broader view.
Resetting to the default zoom settings for a standard view.
Troubleshooting tips for common graphing errors, such as invalid dimension errors.
Using the table and style options for further graph analysis and customization.
Recommendation of the book 'Using the TI-84 Plus' for more detailed information on graphing.
Conclusion and invitation to visit Kemah TechNet for further questions.
Transcripts
Browse More Related Video
Using Your TI-84 Plus CE Part 1: Basic Math
TI84 Plus CE Plotting and Graphing Points
Basic Math - Graphing with a Ti-83 or Ti-84 Calculator

Which TI-84 Plus is Best for You? Reviewing Every TI-84 Plus (CE)!
Solving Linear Equations Using the TI 83 or TI 84 Series Calculator
Quadratic Equations using a TI 83 Plus Graphing Calculator
5.0 / 5 (0 votes)
Thanks for rating: