Statistics: The average | Descriptive statistics | Probability and Statistics | Khan Academy
TLDRThis transcript introduces the viewer to the world of statistics, focusing on its three main categories: descriptive, predictive, and inferential. It explains the concept of central tendency and its measures, including the arithmetic mean, median, and mode. The video uses examples to illustrate how these measures can represent a data set and how they can be affected by outliers. It emphasizes the importance of understanding these statistical tools to effectively interpret and communicate data.
Takeaways
- 📊 Statistics is fundamentally about understanding and interpreting data.
- 📈 There are three main categories of statistics: descriptive, predictive, and inferential.
- 🔍 Descriptive statistics help summarize data without presenting all of it.
- 📐 Predictive and inferential statistics are closely related and involve making conclusions from data samples.
- 🔢 Descriptive statistics often involve finding a 'central tendency' or average of a data set.
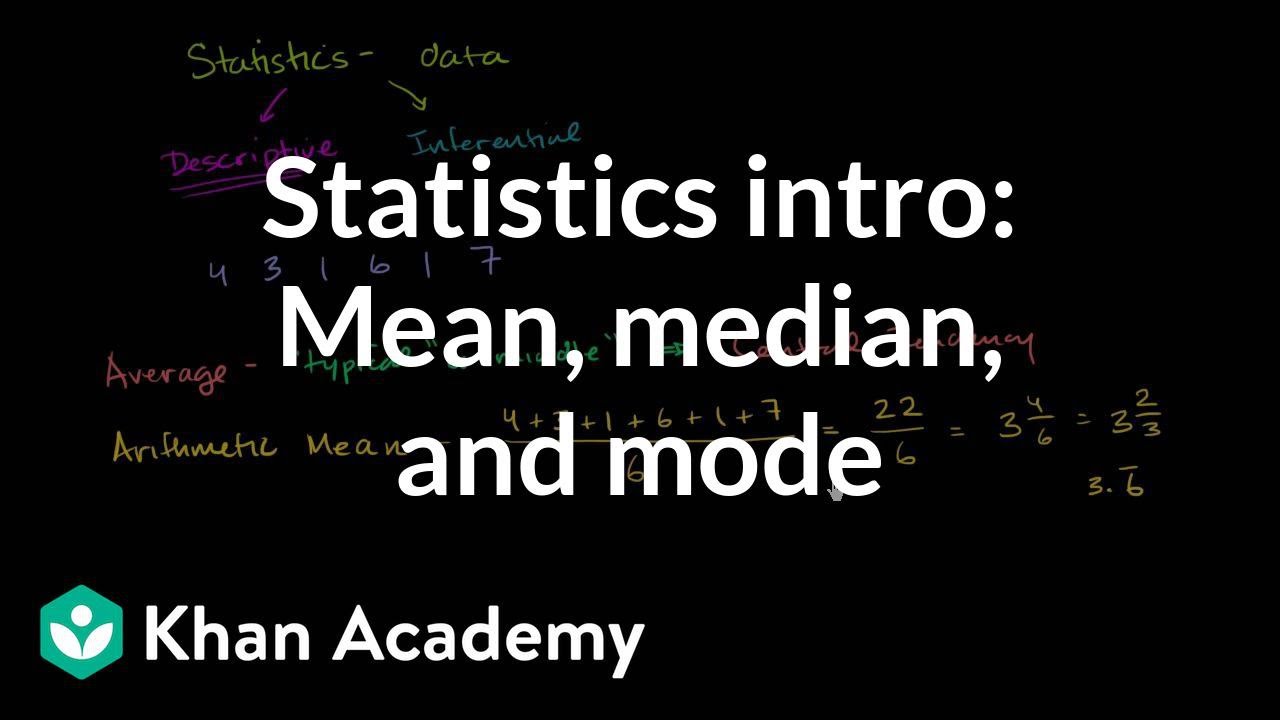
- 🏁 The 'mean', specifically the arithmetic mean, is a common measure of central tendency.
- 🔧 To calculate the arithmetic mean, sum all numbers in a set and divide by the count of numbers.
- 🔥 The 'median' is the middle number in a sorted list and is less affected by outliers.
- 📝 When a set has an even number of observations, the median is the average of the two middle numbers.
- 🌟 The 'mode' is the most frequently occurring number in a data set.
- 🚫 Outliers can skew the arithmetic mean, making the median and mode more representative of the data set in some cases.
Q & A
What is the main purpose of statistics?
-The main purpose of statistics is to get a better understanding of data, which can be used to describe, analyze, and make predictions or inferences about a larger population or process.
What are the three broad categories of statistics mentioned in the transcript?
-The three broad categories of statistics mentioned are descriptive statistics, predictive statistics, and inferential statistics.
What is the difference between a sample and a population in statistics?
-A sample is a subset of a population that is taken to represent the whole population in a study. The population is the entire group that is being studied or from which samples are drawn.
What is the central tendency in statistics?
-The central tendency is a term used to describe a single value that represents the center or typical value of a set of numbers or data.
What are the three measures of central tendency discussed in the transcript?
-The three measures of central tendency discussed are the mean (arithmetic mean), the median, and the mode.
How is the arithmetic mean calculated?
-The arithmetic mean is calculated by adding up all the numbers in a set and then dividing the sum by the total count of numbers in that set.
What is the median and how is it found?
-The median is the middle value in a set of numbers that have been arranged in order of magnitude. If there is an even number of observations, the median is the average of the two middle numbers.
What is the mode in statistics and how does it differ from the mean and median?
-The mode is the value that appears most frequently in a data set. Unlike the mean and median, which are based on the numerical order or sum of values, the mode focuses on the most common value.
Why might the median or mode provide a better representation of a data set than the mean?
-The median or mode can provide a better representation of a data set when there are outliers or extreme values that skew the mean. The median and mode are less sensitive to such values and can offer a more accurate depiction of the typical or central value of the data.
What is an outlier in statistics?
-An outlier is a value that is significantly different from other values in a data set. It can have a disproportionate impact on the mean, making it less representative of the central tendency of the data.
How can understanding the different measures of central tendency help in data analysis?
-Understanding the different measures of central tendency allows analysts to choose the most appropriate measure for representing the data accurately. It helps in providing a more accurate and meaningful interpretation of the data, especially when dealing with skewed distributions or the presence of outliers.
Outlines
📊 Introduction to Statistics and Descriptive Statistics
The video begins by introducing the topic of statistics, emphasizing its relevance and the desire to provide numerous examples for better understanding. It differentiates between descriptive and inferential statistics, explaining that descriptive statistics help summarize data without showing all of it, while inferential statistics make conclusions based on sampled data. The video also touches on the importance of understanding central tendency and introduces the concepts of mean, median, and mode as measures of central tendency. An example with the numbers 1, 1, 2, 3, and 4 is used to illustrate how to calculate the arithmetic mean, providing a clear and simple explanation.
📈 Understanding Central Tendency: Mean, Median, and Mode
This paragraph delves deeper into the concept of central tendency by discussing how the mean, median, and mode can represent a data set. It explains how the mean is calculated by adding all numbers and dividing by the count, using the provided example to show that the mean is 2.2. The median is introduced as the middle value when numbers are ordered, and it is shown to be 2 for the example set. The concept of median is further elaborated with an example of a set with an even number of values, demonstrating how to find the median by averaging the two middle numbers. The mode, representing the most common number in a set, is also explained with the example, highlighting that it can sometimes be ambiguous when multiple numbers appear with the same highest frequency.
📊 Comparing Mean, Median, and Mode in the Presence of Outliers
The final paragraph of the script focuses on the comparison between the mean, median, and mode, especially when there are outliers in the data set. An example with multiple 3's and one outlier (100) is used to illustrate how the mean can be significantly affected by outliers, leading to a less representative central tendency. It is shown that the mean in this case is 19 1/6, which does not seem indicative of the data set. The median, calculated as 3, is introduced as a more robust measure against the influence of outliers. The mode, which is also 3 in this example, is highlighted as another measure that is less affected by outliers. The video script concludes by emphasizing the importance of understanding these measures and their applications in representing data accurately and effectively, and it sets the stage for the next video, which will explore more descriptive statistics, focusing on the spread or dispersion of data.
Mindmap
Keywords
💡Statistics
💡Descriptive Statistics
💡Inferential Statistics
💡Central Tendency
💡Arithmetic Mean
💡Median
💡Mode
💡Outlier
💡Data Set
💡Population
💡Sample
Highlights
Introduction to the playlist on statistics, aiming to provide an intuitive understanding of the subject.
Descriptive statistics defined as a way to summarize data without presenting all of it.
Predictive and inferential statistics are grouped together, used for making conclusions based on data.
The concept of samples versus populations in statistical analysis.
Descriptive statistics involve finding indicative numbers that represent a larger data set.
Explanation of central tendency and its importance in statistics.
Introduction to the arithmetic mean as a measure of central tendency.
Calculation and explanation of the median as a form of average.
How to find the median in a set with an even number of values.
Definition and relevance of the mode in a data set.
Example illustrating the impact of outliers on the arithmetic mean.
Comparison of how median and mode provide a better representation of data without outliers.
Explanation of how the mode can sometimes be ambiguous in sets with multiple common values.
The importance of understanding different measures of central tendency for data analysis.
Practical example of how the median offers a more accurate representation than the mean in certain scenarios.
预告下一期视频将探讨描述性统计学中的离散程度。
Transcripts
Browse More Related Video

Descriptive Statistics [Simply explained]

Elementary Stats Lesson #3 A

Descriptive Statistics: FULL Tutorial - Mean, Median, Mode, Variance & SD (With Examples)
Statistics intro: Mean, median, and mode | Data and statistics | 6th grade | Khan Academy
Elementary Statistics - Chapter 3 Describing Exploring Comparing Data Measure of Central Tendency
Mean, Median and Mode in Statistics | Statistics Tutorial | MarinStatsLectures
5.0 / 5 (0 votes)
Thanks for rating: