Position/Velocity/Acceleration vs. Time Graphs (AP Physics 1)
TLDRThis video script introduces the graphical representation of kinematic quantities such as position, velocity, and acceleration. It explains that these quantities can be visualized on a graph with time on the x-axis and the respective kinematic variable on the y-axis. The script uses the analogy of a 'house with three floors' to illustrate the process of converting between position-time, velocity-time, and acceleration-time graphs. Position is on the top floor, acceleration on the bottom, and velocity in the middle. To move down a level, one must graph the slope of the current graph, while moving up a level involves graphing the area under the graph. The script provides a step-by-step guide to constructing these graphs from a given velocity-time graph, emphasizing the importance of understanding the story each graph tells for analyzing an object's motion.
Takeaways
- 📈 Basic Graphs: The script explains how to graphically represent and analyze kinematic quantities like position, velocity, and acceleration using graphs with time on the x-axis and the respective kinematic quantity on the y-axis.
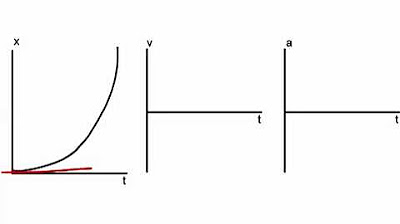
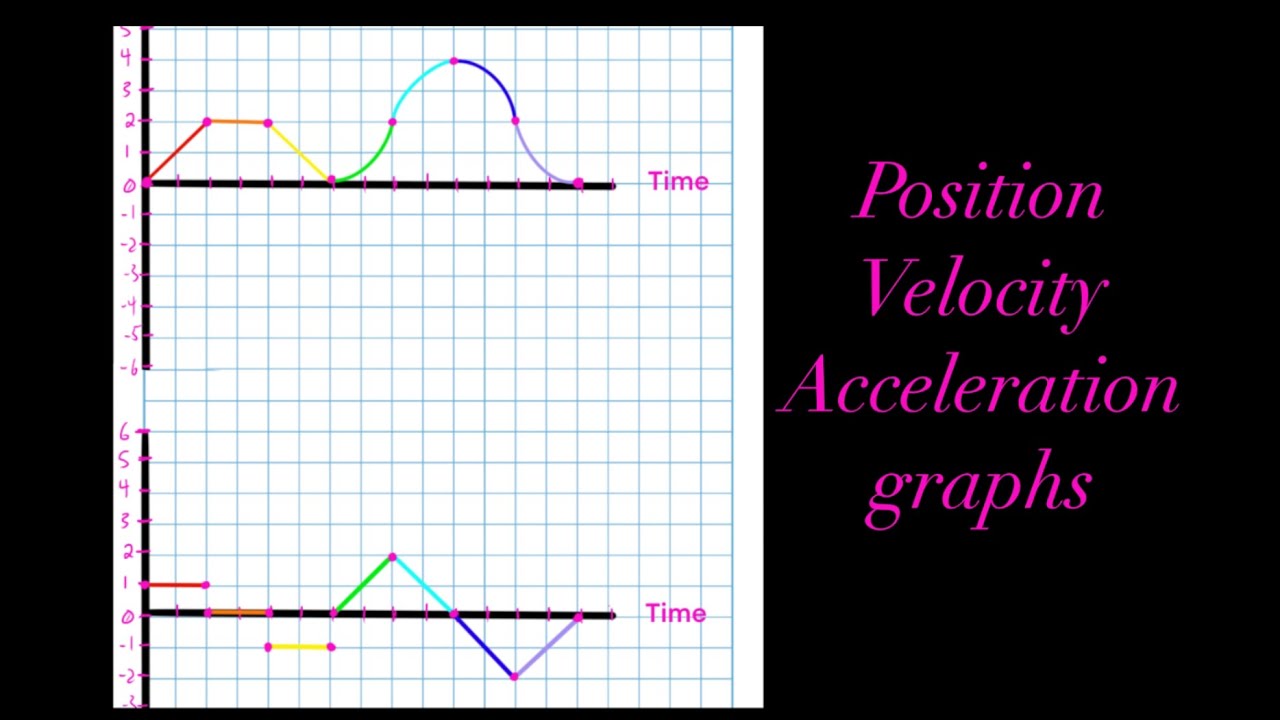
- 🚗 Position vs. Time: The position of an object at any time can be read directly from the position versus time graph, with displacement represented by the difference in position values at two different times.
- 🏎️ Velocity vs. Time: Velocity graphs show the rate at which an object's speed changes over time, and the slope of the graph represents the acceleration.
- ⏱️ Acceleration vs. Time: Acceleration graphs depict how quickly velocity changes over time, with horizontal lines indicating uniform acceleration at different levels.
- 🔄 Conversion Concept: To convert a graph to the next 'floor' or level down, one should graph the slope of the original graph, and to convert up a level, graph the area enclosed by the original graph.
- 📊 Slope Rule: The slope of the velocity versus time graph represents acceleration, which can be calculated using the rise over run method from mathematics.
- 📚 Kinematic Definitions: The script emphasizes the importance of understanding basic kinematic definitions and equations to interpret and convert between different types of graphs.
- 🛣️ Example Scenario: An example of a car traveling on a straight road is used to illustrate how to interpret position, velocity, and acceleration from their respective graphs.
- 📉 Uniform Acceleration: The script mentions that all acceleration graphs should only consist of horizontal lines at different values if the acceleration is uniform.
- 📈 Area Method: To find the position versus time graph, the area under the velocity graph is calculated, which can be done by plotting points and calculating areas under triangles or rectangles.
- 📚 Test Preparation: The script is aimed at helping students prepare for tests by understanding how to interpret and convert between position, velocity, and acceleration graphs.
Q & A
What are the three basic quantities in kinematics that can be expressed and analyzed graphically?
-The three basic quantities in kinematics that can be expressed and analyzed graphically are position, velocity, and acceleration.
Which variable is typically represented on the x-axis in position, velocity, and acceleration versus time graphs?
-In position, velocity, and acceleration versus time graphs, the time variable (T) is typically represented on the x-axis.
How can the position of an object at any time be determined from a position versus time graph?
-The position of an object at any time can be determined from a position versus time graph by identifying the point on the graph corresponding to that specific time, with changes in position or displacement represented by the difference in position values at any two times.
What does the slope of a velocity versus time graph represent?
-The slope of a velocity versus time graph represents acceleration, which is the rate of change of velocity.
How can one convert a position graph to a velocity graph?
-To convert a position graph to a velocity graph, one should graph the slope of the original position graph at any given time, as the slope represents the rate of change of position, which is velocity.
What does the area under a velocity versus time graph represent?
-The area under a velocity versus time graph represents the change in position or displacement over time, which can be used to construct a position versus time graph.
Why should all acceleration graphs consist only of horizontal lines at different values when considering uniform acceleration?
-All acceleration graphs should consist only of horizontal lines at different values when considering uniform acceleration because uniform acceleration implies a constant rate of change of velocity, which translates to a constant slope or zero slope in the graph.
How can the concept of 'levels' or 'floors' of a house be used to understand the relationship between position, velocity, and acceleration graphs?
-The concept of 'levels' or 'floors' of a house can be used to understand the relationship between position, velocity, and acceleration graphs by considering position on the top floor, acceleration on the bottom floor, and velocity in the middle. To convert a graph to the floor underneath, graph the slope of the original graph, and to convert up a level, graph the area enclosed by the original graph.
What does a constant velocity on a velocity versus time graph indicate about the object's motion?
-A constant velocity on a velocity versus time graph indicates that the object is moving at a uniform speed, neither accelerating nor decelerating.
How can one interpret the motion of an object from its graphs, especially when the object turns around or slows down?
-To interpret the motion of an object from its graphs, especially when the object turns around or slows down, one should carefully analyze the changes in slope and area under the graphs, understanding the story the graph is telling about the object's motion over time.
Outlines
📈 Understanding Position, Velocity, and Acceleration Graphs
This paragraph introduces the concept of graphically representing motion variables such as position, velocity, and acceleration. It explains that these are typically plotted with time on the x-axis and the motion variable on the y-axis. The paragraph emphasizes the importance of interpreting graphs to understand an object's motion over time. It also outlines a method for converting between different types of graphs by considering position, velocity, and acceleration as different 'floors' of a house, where the slope of the graph represents the derivative (velocity from position, acceleration from velocity) and the area under the graph represents the integral (position from velocity).
Mindmap
Keywords
💡Position
💡Velocity
💡Acceleration
💡Graphs
💡Kinematic Definitions
💡Time Variable (T)
💡Slope
💡Area Under the Curve
💡Uniform Acceleration
💡Kinematic Equations
Highlights
Understanding the basics of position, velocity, and acceleration is essential for analyzing motion.
Position, velocity, and acceleration can be graphically represented with time on the x-axis and the respective quantity on the y-axis.
Analyzing graphs of position vs. time, velocity vs. time, and acceleration vs. time is a common test question.
The shape of the curve on these graphs represents the variable's function over time.
Position at any time is represented by a point on the graph, with displacement shown by the difference in position values.
Velocity and acceleration graphs follow the same thought process as position graphs for analyzing motion.
Interpreting or converting one type of graph to another is a common task in understanding motion.
Position, velocity, and acceleration can be thought of as different levels or floors of a house for conversion purposes.
To convert a graph to the next level down, graph the slope of the original graph at any given time.
To convert a graph up a level, graph the area enclosed by the original graph at any given time.
The slope of a velocity vs. time graph represents acceleration, derived from the basic kinematic definition.
Acceleration graphs should consist of horizontal lines for uniform acceleration.
The position vs. time graph can be found using the area under the velocity graph.
Graphs can describe complex motion, including objects turning around or slowing down.
Understanding the story the graph is telling is crucial for analyzing motion accurately.
Learning to interpret position, velocity, and acceleration graphs is fundamental for understanding motion.
Transcripts
Browse More Related Video

Velocity Time Graphs, Acceleration & Position Time Graphs - Physics
Kinematics Graphs

High School Physics: Graphing Motion
Position vs Time, Velocity vs Time & Acceleration vs Time Graph (Great Trick to Solve Every Graph!!)
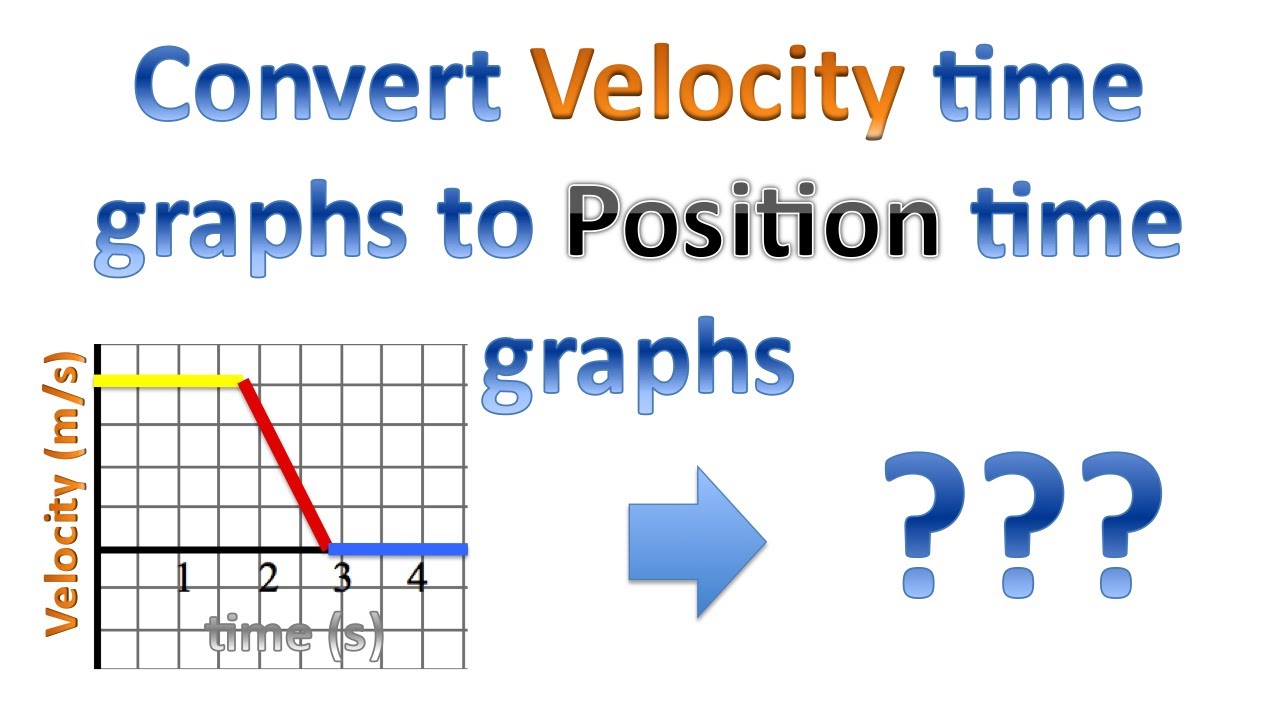
Velocity time graph conversion to Position time graph
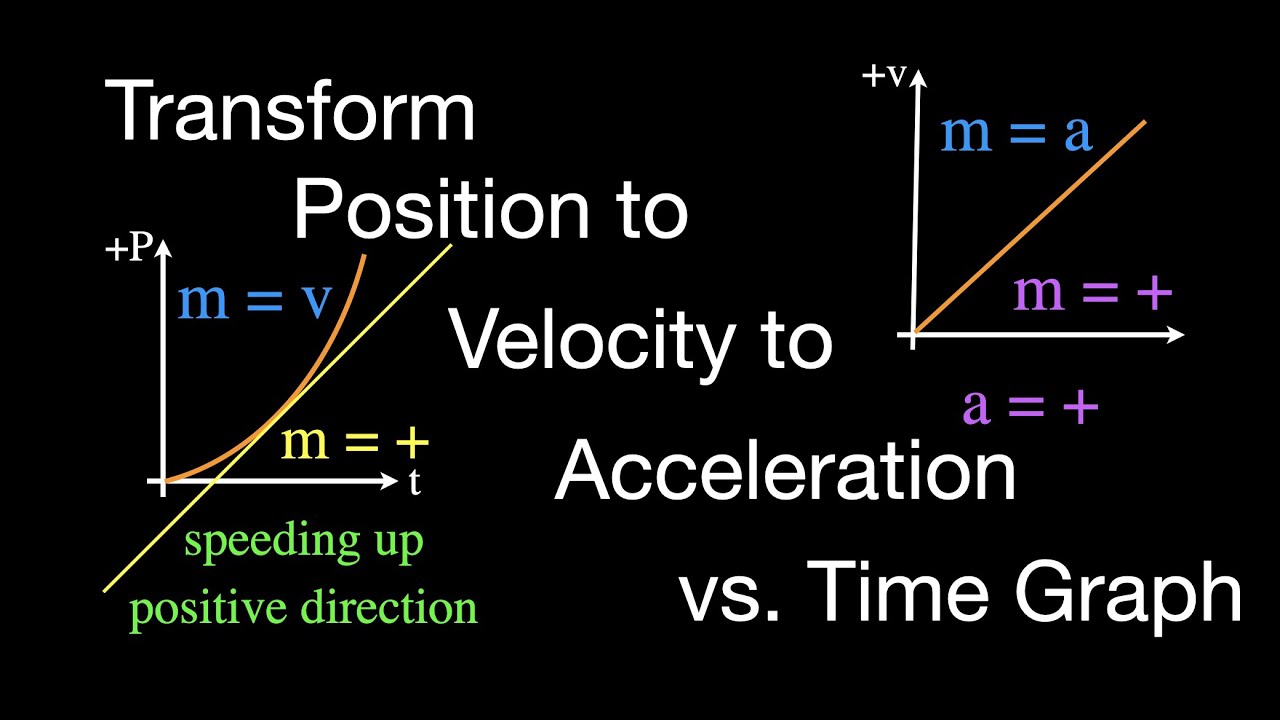
Motion Graphs: Transforming Position to Velocity to Acceleration vs Time
5.0 / 5 (0 votes)
Thanks for rating: