t Distribution and t Scores in R | R Tutorial 3.4 | MarinStatsLectures
TLDRIn this instructional video, Mike Marin explains how to find probabilities and percentiles for the T-distribution, crucial for calculating P-values and constructing confidence intervals. Focusing on a t-distribution with specific parameters, he demonstrates using R's PT and QT commands to calculate one-sided and two-sided P-values, and to find critical T-values for a 95% confidence interval. The video also briefly introduces the PF and P commands for F and exponential distributions, respectively, encouraging viewers to explore further.
Takeaways
- 📚 The video is an instructional guide on finding probabilities and percentiles for the T-distribution, which is useful for calculating P-values and critical values for confidence intervals.
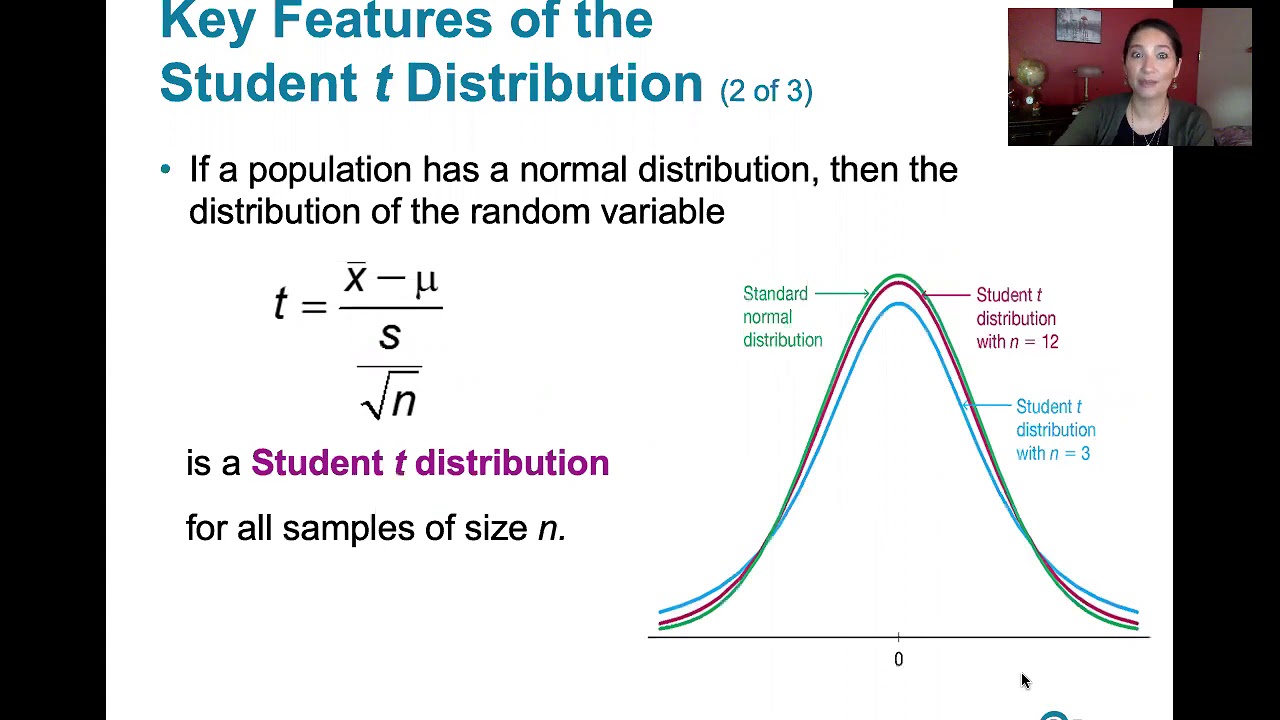
- 🔍 The focus is on a T-distribution with a mean of zero, standard deviation of 1, and 25 degrees of freedom.
- 💻 The PT command in R is used to calculate probabilities for a given T-statistic and degrees of freedom, with the lower tail argument set to false for upper tail probabilities.
- 📈 A one-sided P-value for a T-statistic of 2.3 with 25 degrees of freedom is found to be 1.5% using the PT command in R.
- 🔁 To find the two-sided P-value, one should calculate the probabilities for both tails (above 2.3 and below -2.3) and sum them, resulting in a 3% P-value.
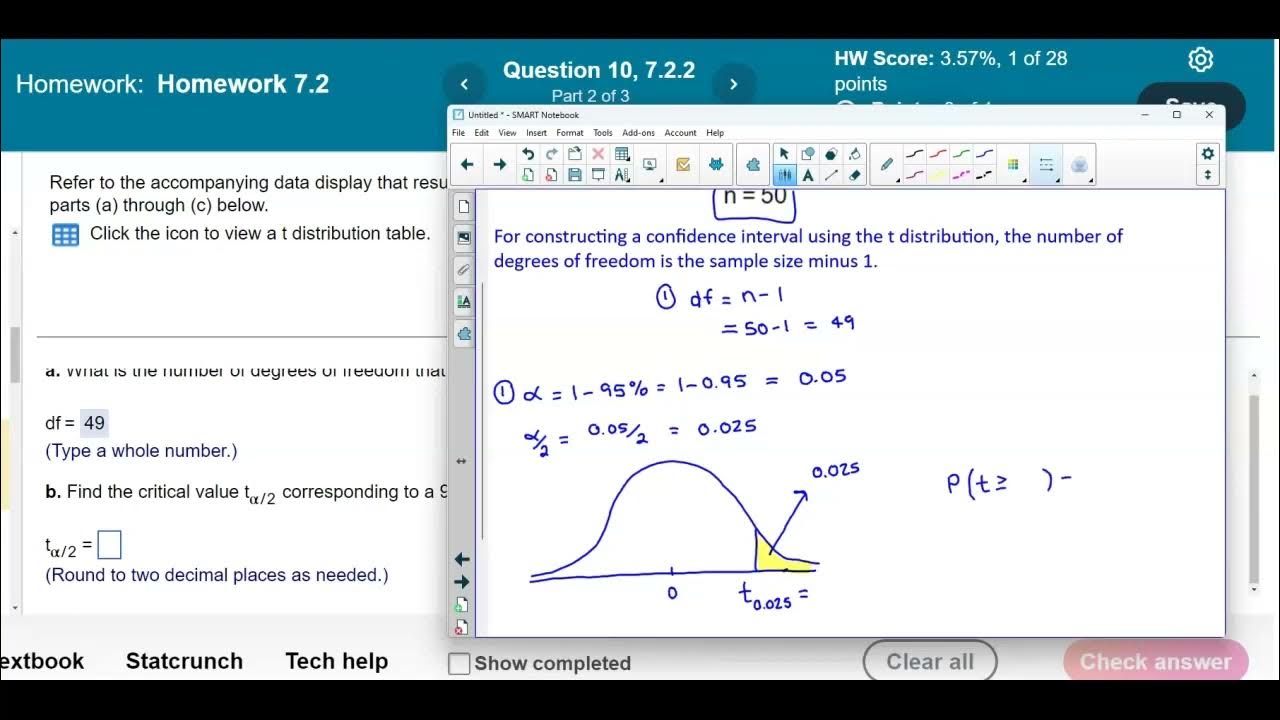
- 📊 The QT command in R is utilized to find the critical T-value for constructing confidence intervals, given a specific confidence level and degrees of freedom.
- 🔢 For a two-sided 95% confidence interval, the critical T-value is found using the QT command with 2.5% in each tail, resulting in a critical value of -2.06.
- 🔄 The video suggests that doubling the one-sided P-value can also provide an approximation for the two-sided P-value.
- 📚 The PF command can be used to look up probabilities for the F-distribution, while the P command is for the exponential distribution.
- 📘 The video encourages viewers to explore the help menus in R for further assistance with statistical commands.
- 👨🏫 The presenter, Mike Marin, promises to cover how to conduct a T-Test and construct confidence intervals using R in the next video of the series.
Q & A
What is the main topic of the video by Mike Marin?
-The main topic of the video is about finding probabilities and percentiles for the T-distribution, which can be used for calculating P-values or finding critical values for constructing confidence intervals for statistics that follow a T-distribution.
What is the specific T-distribution statistic discussed in the video?
-The video focuses on a T-distribution statistic with a mean of zero, a standard deviation of 1, and 25 degrees of freedom.
How can one access the help menu in R for a specific command?
-To access the help menu in R, you can type 'help' followed by the command name in brackets, or simply place a question mark in front of the command you need help with.
What is the purpose of the PT command in R?
-The PT command in R is used to calculate probabilities associated with a T-distribution. It can help find the probability of a T statistic being greater than or less than a certain value.
How can you find the one-sided P-value for a T statistic of 2.3 with 25 degrees of freedom in R?
-You can find the one-sided P-value using the PT command in R by setting the lower tail argument to false and asking for the upper tail probability or the area above 2.3.
What is the one-sided P-value for a T statistic of 2.3 with 25 degrees of freedom according to the video?
-The one-sided P-value for a T statistic of 2.3 with 25 degrees of freedom is 1.5%.
How can you calculate the two-sided P-value for the same T statistic?
-To calculate the two-sided P-value, you find the area above 2.3 and the area below -2.3 separately, then add these probabilities together.
What is the two-sided P-value for a T statistic of 2.3 with 25 degrees of freedom in the video example?
-The two-sided P-value for a T statistic of 2.3 with 25 degrees of freedom is 3%.
What command in R is used to find the critical T value for a confidence interval?
-The QT command in R is used to find the critical T value for a confidence interval by determining the quantile for the T-distribution.
How do you construct a two-sided 95% confidence interval using the T distribution in R?
-To construct a two-sided 95% confidence interval, you use the QT command to find the T value associated with a probability of 0.025 in each tail (2.5% in the lower tail and 2.5% in the upper tail).
What additional commands are mentioned in the video for looking up probabilities for other distributions?
-The PF command is used for looking up probabilities for the F-distribution, and the P command is used for the exponential distribution.
What is the critical T value for a 95% confidence interval with 25 degrees of freedom in the video example?
-The critical T value for a 95% confidence interval with 25 degrees of freedom is -2.06 in the lower tail.
Outlines
📊 Introduction to T-Distribution Probabilities and Percentiles
In this introductory paragraph, Mike Marin explains the purpose of the video, which is to discuss the calculation of probabilities and percentiles for the T-distribution. This is essential for determining P-values and critical values, particularly for statistics that follow a T-distribution with specific parameters: a mean of zero, a standard deviation of 1, and 25 degrees of freedom. The video will focus on using the PT command in R to calculate these values, and viewers are encouraged to access the help menu for further guidance on using the command. An example is provided where a t-test statistic of 2.3 is used to find the one-sided P-value, demonstrating the process of calculating the probability of T being greater than 2.3.
🔍 Calculating One-Sided and Two-Sided P-Values in R
This paragraph delves into the specifics of calculating one-sided and two-sided P-values using R's PT command. The process involves setting the 'lower tail' argument to 'false' for one-sided probabilities and calculating the area above a given t-value. For two-sided P-values, the probabilities for both tails (above the positive and below the negative t-values) are calculated separately and then summed. The example demonstrates finding the two-sided P-value by doubling the one-sided P-value or by calculating the probabilities for both tails and adding them together.
📐 Constructing Confidence Intervals with the T-Distribution
The focus shifts to constructing confidence intervals using the T-distribution. The QT command in R is introduced for finding the T value that corresponds to a specific percentile, which is crucial for creating confidence intervals. The paragraph explains how to use the QT command to determine the critical T value for a two-sided 95% confidence interval by setting the 'lower tail' argument to 'true' and specifying the desired tail probability. The critical value found, -2.06 in the example, is the threshold used for the confidence interval.
📚 Exploring Further Statistical Distributions in R
The final paragraph wraps up the video by mentioning the next steps in the series, which will involve conducting T-tests and constructing confidence intervals using R. It also highlights the usefulness of exploring R's help menus for additional commands like PF and P, which are used for looking up probabilities for the F-distribution and the exponential distribution, respectively. The video concludes by encouraging viewers to watch more instructional videos by Mike Marin.
Mindmap
Keywords
💡Probability
💡Percentiles
💡P-values
💡T-distribution
💡Degrees of Freedom
💡Confidence Intervals
💡Critical Values
💡PT command in R
💡QT command in R
💡Hypothesis Testing
💡Help Menu in R
Highlights
The video discusses finding probabilities and percentiles for the T-distribution.
T-distribution can be used for finding P-values and constructing confidence intervals.
Focuses on a t statistic with a mean of zero, standard deviation of 1, and 25 degrees of freedom.
Demonstrates using the PT command in R to calculate probabilities.
Shows how to access the help menu in R for the PT command.
Example given: finding the one-sided P-value for a t-test statistic of 2.3 with 25 degrees of freedom.
Explains calculating the upper tail probability or the area above a t-value.
The one-sided P-value for the example is 1.5%.
Describes finding the two-sided P-value by calculating areas above and below -2.3.
The two-sided P-value for the example is 3%.
Mentions doubling the one-sided P-value as an alternative method for finding the two-sided P-value.
Introduces constructing a two-sided 95% confidence interval using the QT command.
Details finding the T value for 95% confidence with 2.5% in each tail.
Shows the critical value of -2.06 for the 95% confidence interval.
Announces a follow-up video on conducting T-Tests and confidence intervals using R.
Suggests exploring help menus for PF and P commands for F and exponential distributions.
The PF command is for looking up probabilities for the F-distribution.
The P command is for looking up probabilities for the exponential distribution.
Encourages viewers to watch other instructional videos by Mike Marin.
Transcripts
Browse More Related Video

One-Sample t Test & Confidence Interval in R with Example | R Tutorial 4.1| MarinStatsLectures
Math 14 HW 7.2.2 Find the degrees of freedom and critical t value.

How to calculate p-values

Elementary Statistics - Chapter 7 - Estimating Parameters and Determining Sample Sizes Part 2
7.2.1 Estimating a Population Mean - Student t Distribution and Finding Critical t Values
Two-Sample t Test in R (Independent Groups) with Example | R Tutorial 4.2 | MarinStatsLectures
5.0 / 5 (0 votes)
Thanks for rating: