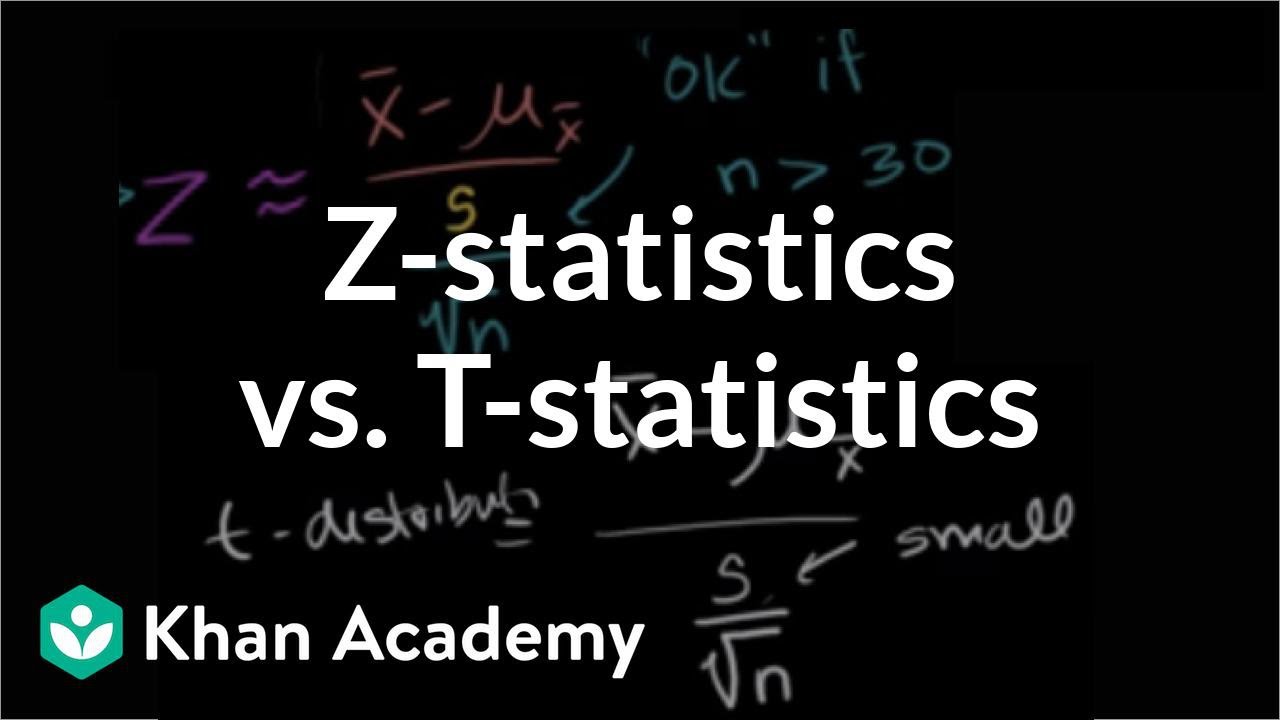
Z-Statistics vs. T-Statistics EXPLAINED in 4 Minutes
TLDRThe video script by Mark from Ace Tutors elucidates the distinction between z-statistics and t-statistics, and their appropriate applications. It explains that z-scores are used for individual sample values when the population standard deviation is known, while t-statistics are employed when this standard deviation is unknown and replaced with the sample's standard deviation. The script emphasizes the increased uncertainty with smaller sample sizes, leading to more dispersed distributions, and how larger samples improve the accuracy of the t-statistic, approximating a normal distribution.
Takeaways
- 📚 The main topic is the difference between z-statistics and t-statistics and their appropriate usage.
- 🔢 A z-score (x - μ) / σ is used for a single value in a sample to compare it to the sample size.
- 📈 A z-statistic (x̄ - μ) / (σ / √n) is used for comparing an entire sample mean to the population mean when the population standard deviation is known.
- 🤔 The z-statistic formula requires knowledge of the population mean, sample size, and population standard deviation.
- 🔍 When the population standard deviation is unknown, the t-statistic is used with the sample standard deviation as a replacement.
- 🧐 The t-statistic accounts for the increased uncertainty from using a sample standard deviation instead of the population standard deviation.
- 📊 Smaller sample sizes lead to less confidence in the normal distribution and a more spread out distribution (higher t-value).
- 🔄 As sample size increases, the sample standard deviation becomes a better estimate, and the distribution approaches a normal distribution.
- 📝 The rule of thumb is to use z-statistics when the population standard deviation is known, and t-statistics when it is unknown.
- 🌟 The video aims to clarify a common statistical concept to help students better understand and apply these tests.
- 💡 Understanding the difference between z and t statistics is crucial for accurate statistical analysis and interpretation.
Q & A
What is the main difference between a z-score and a z-statistic?
-A z-score is used for a single value in a sample (like a single grade) compared to the mean and standard deviation of that sample. A z-statistic, on the other hand, is used when comparing the mean of a sample to the mean of a larger population, taking into account the population standard deviation and the sample size.
Why might you use a t-statistic instead of a z-statistic?
-You would use a t-statistic when the population standard deviation is unknown. Instead of using the population standard deviation, you replace it with the standard deviation of your sample in the calculation.
How does the sample size affect the accuracy of the t-statistic?
-A smaller sample size means that the sample standard deviation is a less accurate estimate of the population standard deviation, leading to a distribution that is more spread out. As the sample size increases, the distribution becomes more like a normal distribution, increasing the confidence in the accuracy of the t-statistic.
What is the main rule of thumb for deciding between using z-statistics and t-statistics?
-Use z-statistics when the population standard deviation is known, and t-statistics when it is unknown.
How does the normal distribution relate to the use of z-statistics?
-Z-statistics are used with the assumption that the distribution of the data follows a normal distribution. This is why having the population standard deviation is crucial, as it defines the shape of the normal distribution.
What is the population standard deviation and why is it important in statistics?
-The population standard deviation is a measure of the variability or spread of the entire population's data. It is important because it helps define the normal distribution and is a key component in calculating z-statistics.
What does the mean of a sample represent?
-The mean of a sample (x-bar) represents the average value of the data points within that sample. It is used in calculations to compare the sample to the larger population.
Why is it impractical to find the population standard deviation in some cases?
-It is impractical because it would require data from every single member of the population, which is often impossible or extremely difficult to obtain, such as in the case of all stat students in the world.
How does the accuracy of the sample standard deviation affect the shape of the distribution?
-The less accurate the sample standard deviation, the more spread out the distribution will be, with more weight in the tails. This reflects a lower confidence in the normal distribution shape.
What is the significance of the sample size (n) in statistical analysis?
-The sample size is significant because it affects the precision of estimates like the mean and standard deviation. A larger sample size generally leads to more reliable and generalizable results.
How can you increase confidence in your statistical analysis?
-You can increase confidence by using larger sample sizes, which provide more accurate estimates of population parameters, and by using appropriate statistical methods for the data you have, such as using t-statistics when the population standard deviation is unknown.
Outlines
📚 Introduction to Z and T Statistics
This paragraph introduces the topic of the video, which is the difference between Z and T statistics and their respective use cases. Mark from Ace Tutors explains that many students struggle with understanding these concepts. The paragraph sets the stage for a deeper dive into the distinction between a Z score, used for a single value in a sample, and a Z statistic, used for an entire sample in relation to a larger population. It also mentions the prerequisites for understanding Z statistics, including knowledge of the normal distribution.
Mindmap
Keywords
💡Z statistics
💡T statistics
💡Normal distribution
💡Sample mean (x̄)
💡Population mean (μ)
💡Standard deviation (σ)
💡Sample size (n)
💡Z score
💡Estimation
💡Statistical inference
💡Distribution shape
Highlights
The main topic is the difference between z-statistics and t-statistics and their usage.
Z-score is used for a single value in a sample compared to the sample size.
Z-statistic is used when examining an entire sample in relation to a larger population.
The formula for z-score is z = (x - mean) / standard deviation.
To use z-statistic, the population mean, sample mean, sample size, and population standard deviation are required.
T-statistic is used when the population standard deviation is unknown.
In place of the population standard deviation, the sample standard deviation can be used for calculating t-statistic.
Sample standard deviation is an estimate and introduces some margin of error.
Smaller sample sizes result in less confidence in the normal distribution of the data.
Larger sample sizes increase the confidence in the sample standard deviation and its resemblance to a normal distribution.
Use z-statistics when the population standard deviation is known; otherwise, use t-statistics.
The video aims to clarify a common point of confusion among students.
Understanding the difference between z and t statistics is crucial for accurate statistical analysis.
The video provides practical applications for understanding when to use each type of statistic.
The presenter encourages viewers to subscribe for more helpful content.
The video concludes with a motivational message about not letting a class get in the way of one's dreams.
Transcripts
Browse More Related Video
Z-statistics vs. T-statistics | Inferential statistics | Probability and Statistics | Khan Academy
Introduction to the t Distribution (non-technical)
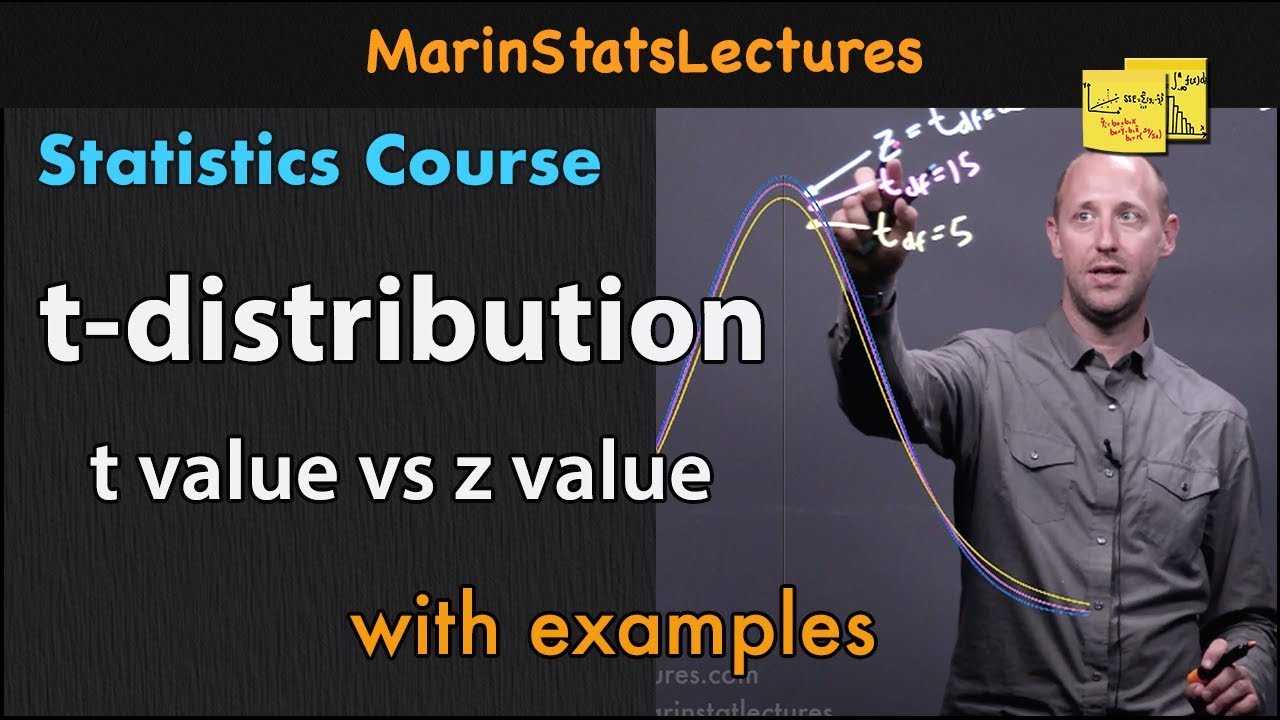
t-distribution in Statistics and Probability | Statistics Tutorial #9 | MarinStatsLectures
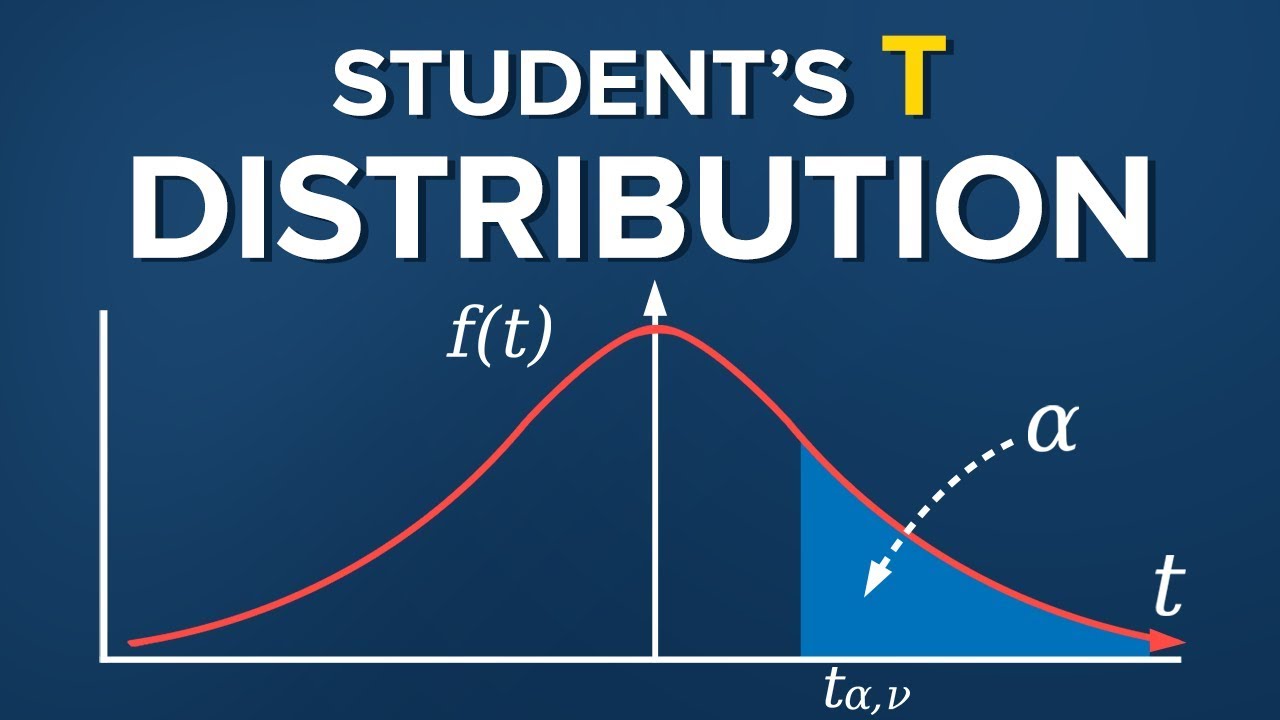
Student's T Distribution
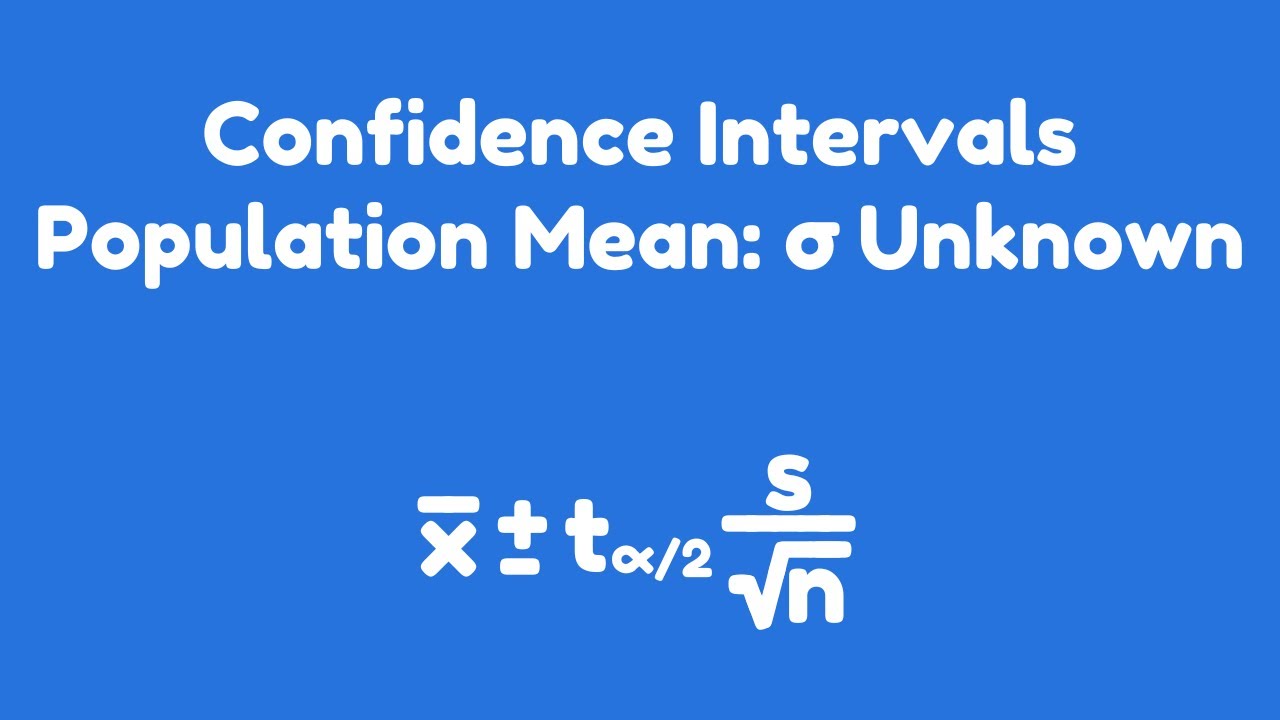
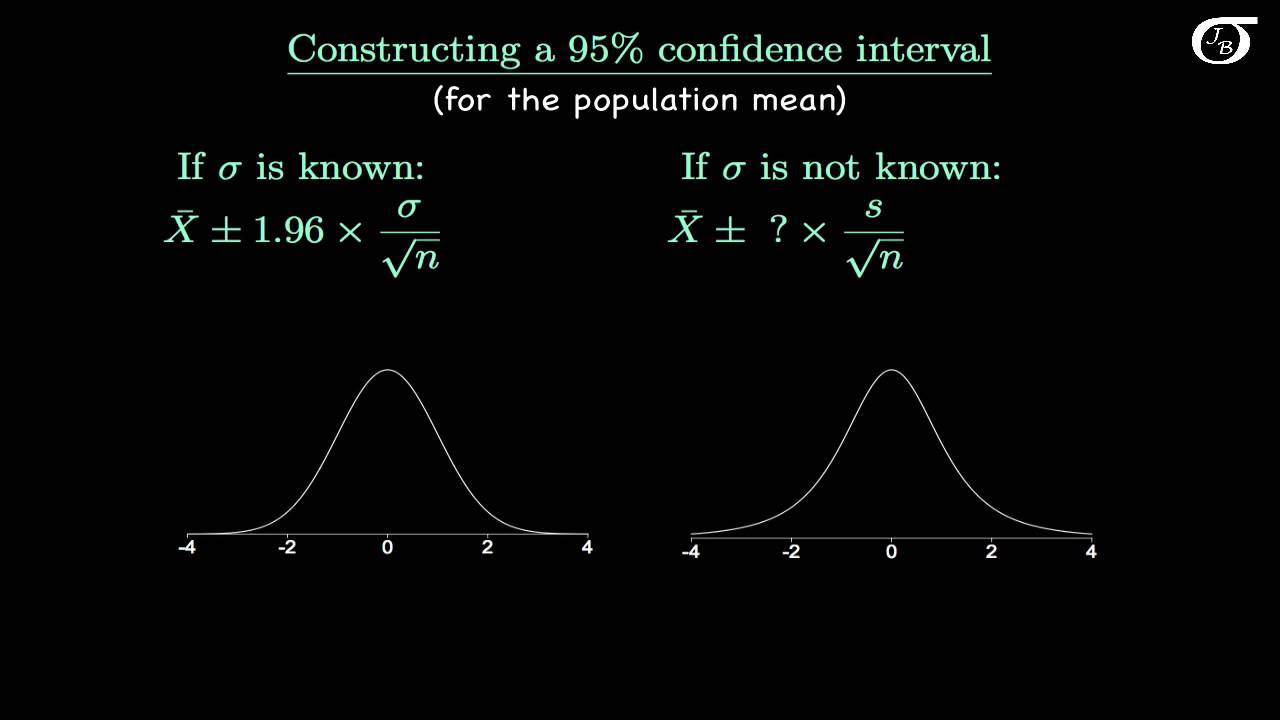
Confidence Intervals | Population Mean: σ Unknown

Elementary Statistics - Chapter 7 - Estimating Parameters and Determining Sample Sizes Part 2
5.0 / 5 (0 votes)
Thanks for rating: