Z-statistics vs. T-statistics | Inferential statistics | Probability and Statistics | Khan Academy
TLDRThe video script explains the distinction between Z-statistics and T-statistics in inferential statistics. It emphasizes that Z-statistics are used with large sample sizes under the assumption that the population standard deviation is known, allowing for probabilities to be determined using a Z-table. Conversely, T-statistics apply when the sample size is less than 30, as the population standard deviation is unknown, necessitating the use of a T-table to find probabilities. The central limit theorem is highlighted, noting that sample sizes greater than 30 result in a normal distribution of sample means, while smaller sample sizes lead to a T-distribution.
Takeaways
- 📊 Understanding the difference between Z-statistics and T-statistics is crucial in inferential statistics.
- 🧠 The main goal in inferential statistics is to determine the probability of obtaining a certain sample mean.
- 📈 A sampling distribution of the sample mean is used to visualize the distribution with an assumed mean value and standard deviation.
- 🔍 To find the probability of an extreme result, calculate the area under the curve to the left of the sample mean or subtract from 1 the area to the right.
- 📐 The number of standard deviations from the mean is found by using the formula: (sample mean - population mean) / standard deviation of the sampling distribution.
- 📚 The Central Limit Theorem states that with a sufficient sample size, the sampling distribution will approximate the population standard deviation.
- 🔢 When the sample size is large (greater than 30), the standard deviation of the sample is a good estimator for the population standard deviation, and the Z-statistic is used.
- 🎯 For a Z-statistic, the probability of getting a value is found using a Z-table, assuming normal distribution.
- 👉 If the sample size is small (less than 30), the T-distribution is used instead of the normal distribution, and a T-table is needed to find the probability.
- 📋 The key to choosing between Z-statistics and T-statistics lies in the sample size: Z for large samples and T for small samples.
- 🌟 The video aims to clarify when to use a Z-statistic and when to use a T-statistic in statistical analysis.
Q & A
What is the main difference between a Z-statistic and a T-statistic?
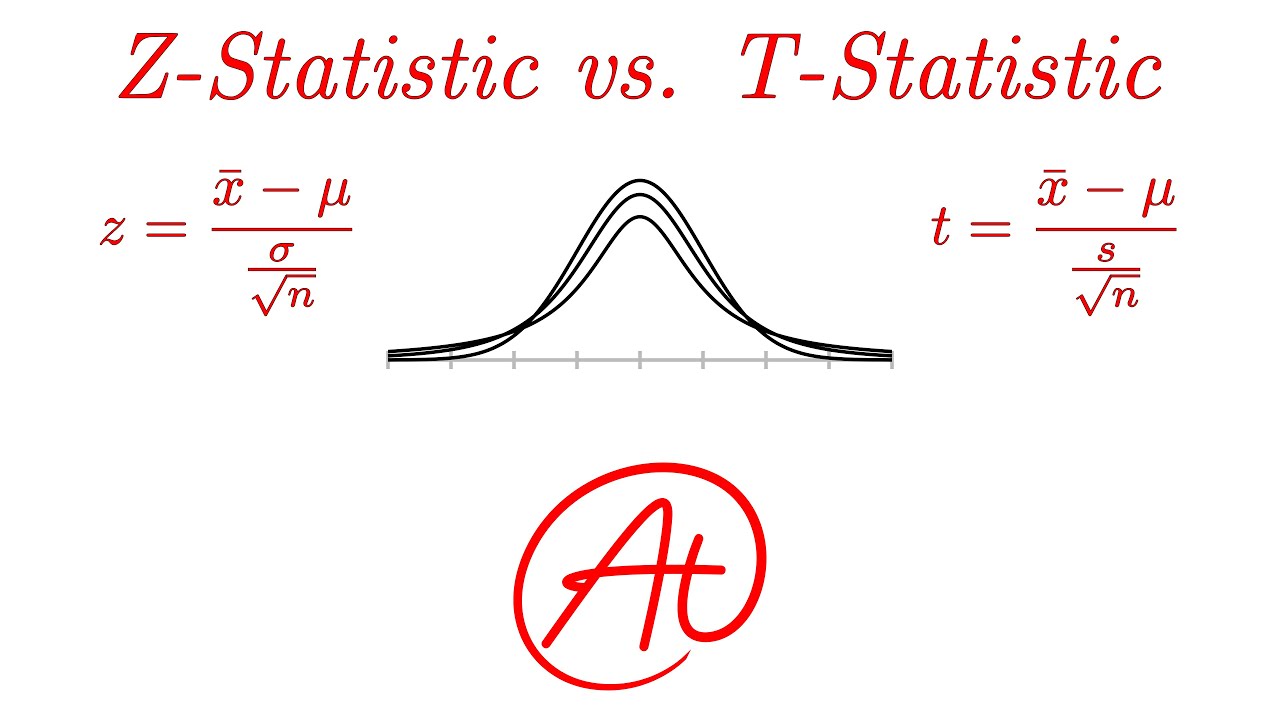
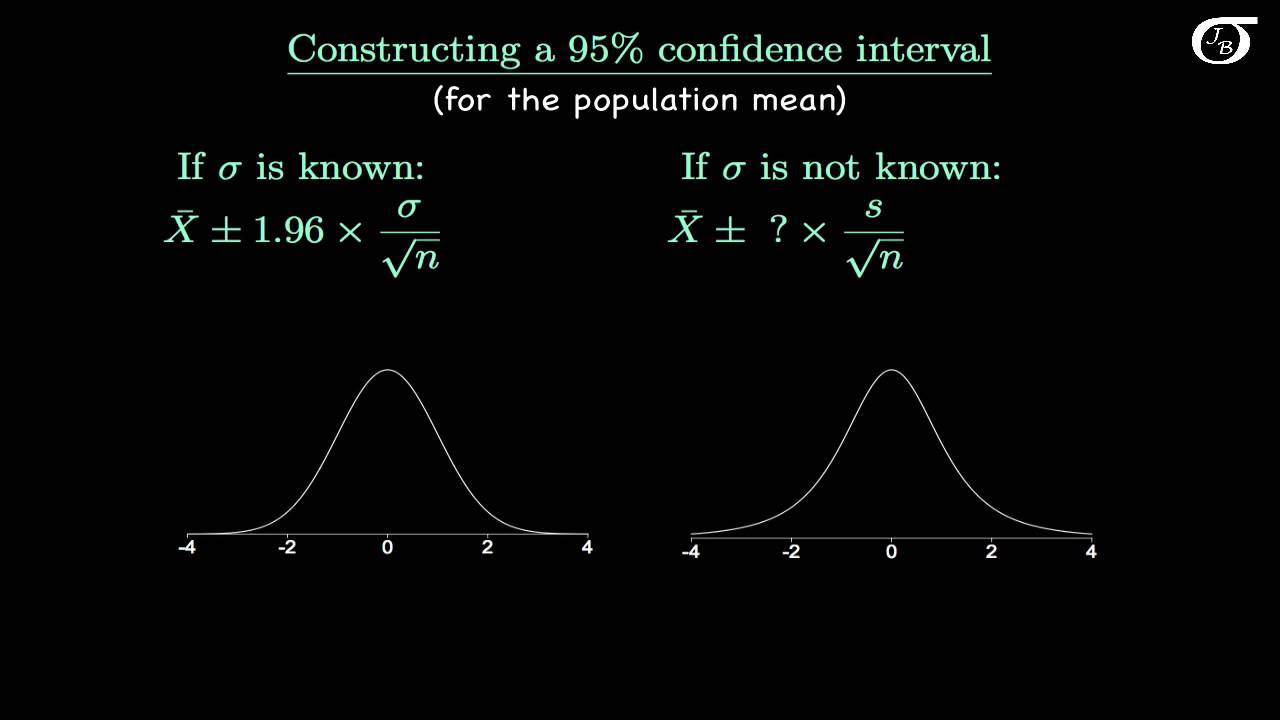
-A Z-statistic is used when the population standard deviation is known and the sample size is large (typically n > 30), allowing the use of the normal distribution for calculations. A T-statistic is used when the population standard deviation is unknown and the sample size is small (n ≤ 30), requiring the use of a T-distribution.
How does the central limit theorem relate to inferential statistics?
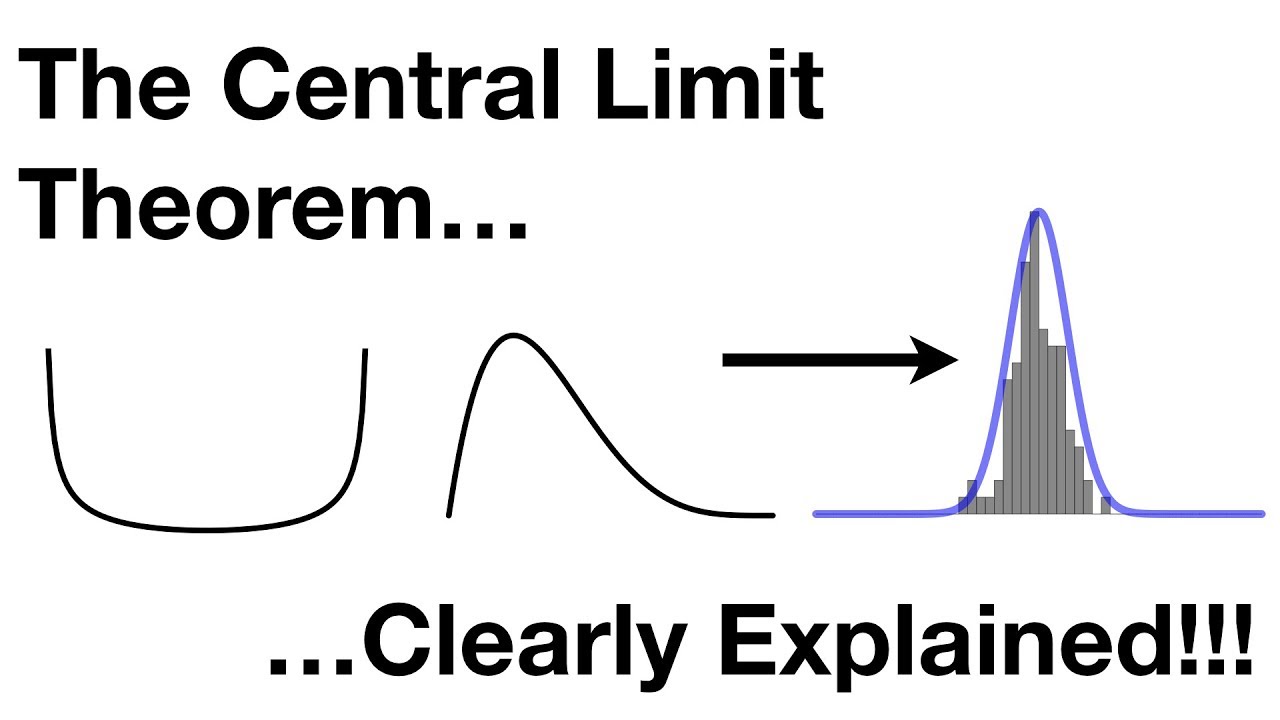
-The central limit theorem states that, given a sufficient sample size, the sampling distribution of the sample mean will be approximately normally distributed. This allows us to use the Z-statistic for large samples to estimate probabilities based on the normal distribution.
What is the formula for calculating a Z-score?
-The Z-score is calculated as (sample mean - population mean) / (population standard deviation / √sample size). It measures how many standard deviations an observation or sample mean is from the population mean.
What is the formula for calculating a T-score?
-The T-score is calculated as (sample mean - assumed mean) / (sample standard deviation / √sample size). It is used when the population standard deviation is unknown and the sample size is small.
How do you determine whether to use a Z-table or a T-table for a given statistical problem?
-If the sample size is large (n > 30) and the population standard deviation is known, use a Z-table. If the sample size is small (n ≤ 30) or the population standard deviation is unknown, use a T-table.
What is the significance of the sample size in choosing between a Z-statistic and a T-statistic?
-The sample size is crucial because it determines the distribution type we can assume for our data. Large samples (n > 30) can be assumed to follow a normal distribution, while small samples (n ≤ 30) require the use of a T-distribution, which accounts for additional variability due to the unknown population standard deviation.
What happens to the sampling distribution if the sample size is less than 30?
-If the sample size is less than 30, the sampling distribution is not normally distributed. Instead, it follows a T-distribution, which is more appropriate for smaller sample sizes and accounts for the uncertainty in the estimate of the population standard deviation.
How does the process of calculating the probability of getting a certain sample mean change with a small sample size?
-With a small sample size, you calculate the T-score instead of the Z-score and use a T-table to find the probability of getting a result at least as extreme as the observed sample mean. This accounts for the increased variability and uncertainty in the estimate of the population standard deviation.
What is the role of the standard deviation in the calculation of Z-scores and T-scores?
-The standard deviation plays a key role in both calculations. For Z-scores, it's used to divide the difference between the sample mean and the population mean to find out how many standard deviations away from the mean the sample mean is. For T-scores, the sample standard deviation is used as an estimate for the population standard deviation when it's unknown.
Can you use a Z-table to find the probability of a T-score?
-No, Z-tables and T-tables are based on different distributions. A Z-table is for normal distribution, while a T-table is for T-distribution. Using a Z-table for T-scores would not give accurate results.
What is the concept of 'extreme' results in the context of inferential statistics?
-In inferential statistics, 'extreme' results refer to outcomes that are unlikely to occur by chance if the null hypothesis is true. By calculating the probability of getting a result at least as extreme as the observed sample mean, we can assess whether the observed results are statistically significant and potentially warrant rejection of the null hypothesis.
Outlines
📊 Understanding Z-Statistics and T-Statistics
This paragraph introduces the concepts of Z-statistics and T-statistics in inferential statistics. It explains that the focus is on determining the probability of obtaining a certain sample mean. The paragraph details the process of calculating the number of standard deviations a sample mean is from the mean of the sampling distribution, which is done by subtracting the assumed mean and dividing by the standard deviation. The central limit theorem is mentioned, stating that with a sufficient sample size, the sampling distribution will approximate the population standard deviation divided by the square root of the sample size. The paragraph distinguishes between Z-scores, used when the population standard deviation is known, and T-scores, used when it is unknown and the sample size is small. It concludes by emphasizing the importance of using Z-tables for larger sample sizes and T-tables for smaller ones to find the probability of extreme results.
📈 Application of Z-Statistics and T-Statistics Based on Sample Size
This paragraph delves into the application of Z-statistics and T-statistics based on the sample size. It clarifies that when the sample size is greater than 30, the sample standard deviation can be used as a good estimator for the population standard deviation, making the distribution approximately normal, and allowing the use of a Z-table to calculate probabilities. Conversely, if the sample size is less than 30, the distribution is not normal, and a T-distribution is assumed, requiring the use of a T-table to find the probability of extreme T-values. The paragraph emphasizes the importance of sample size in determining which statistic to use and how to interpret the distribution of results accordingly.
Mindmap
Keywords
💡Z-statistic
💡T-statistic
💡Inferential statistics
💡Sampling distribution
💡Standard deviation
💡Central Limit Theorem
💡Population mean
💡Sample mean
💡Probability
💡Normal distribution
💡T-distribution
Highlights
The video aims to clarify the difference between a Z-statistic and a T-statistic.
In inferential statistics, the focus is on determining the probability of obtaining a certain sample mean.
A sampling distribution of the sample mean is used to understand the distribution's mean value and standard deviation.
The probability of getting a result at least as extreme as a given sample mean can be found by calculating the area under the curve.
The Z-statistic is calculated by dividing the difference between the sample mean and the population mean by the standard deviation of the sampling distribution.
The central limit theorem states that with a sufficient sample size, the sampling distribution will be approximately normally distributed.
The standard deviation of the population can be estimated by the sample standard deviation divided by the square root of the sample size.
A Z-score is used when the sample size is large, and the population standard deviation is known.
A T-score is used when the sample size is small, and the population standard deviation is unknown.
For sample sizes greater than 30, the sample standard deviation is a good approximator for the population standard deviation.
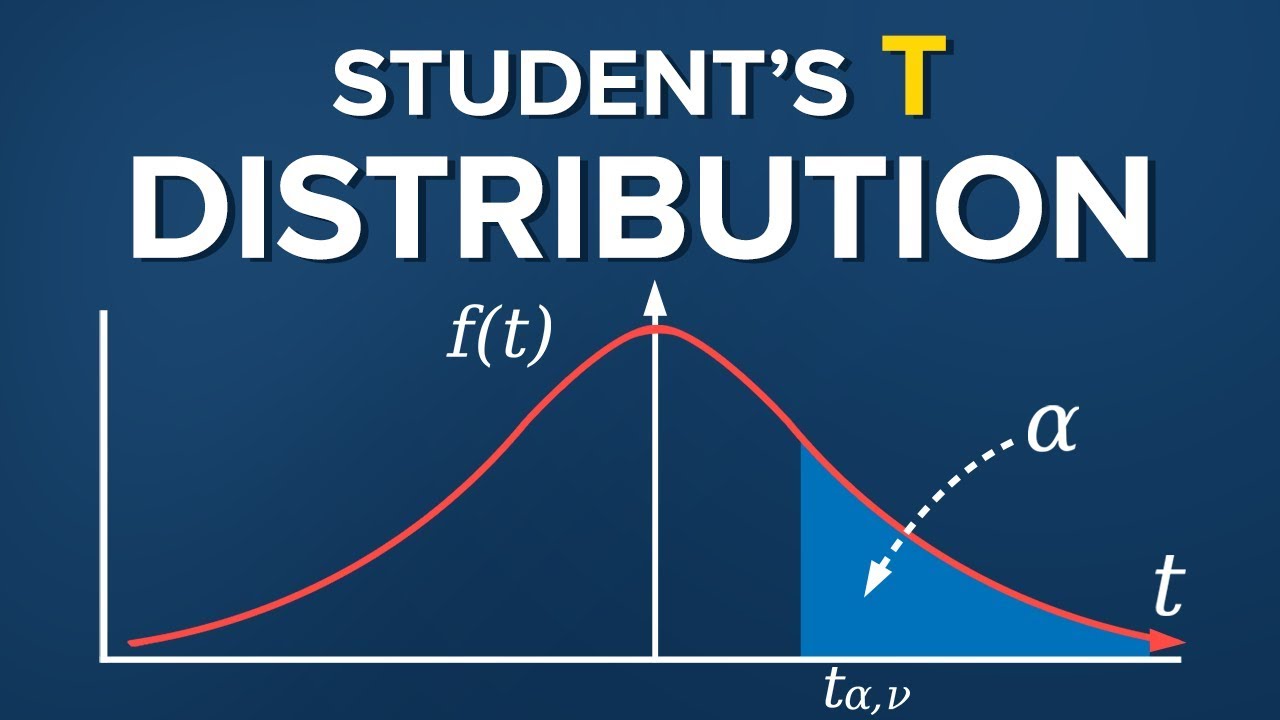
A T-distribution is used when the sample size is less than 30, and the distribution is not normal.
The T-value is calculated similarly to the Z-score, but using a T-distribution instead of a normal distribution.
The probability of getting a T-value at least as extreme as a given result can be found using a T-table.
The video provides a clear explanation of when to use a Z-statistic and when to use a T-statistic in statistical analysis.
The video emphasizes the importance of sample size in determining the appropriate statistical method to use.
The video explains the concept of standard deviation in the context of both Z-scores and T-scores.
The video illustrates the process of calculating probabilities using both Z-tables and T-tables.
The video provides a practical guide for understanding the application of Z-statistics and T-statistics in inferential statistics.
Transcripts
Browse More Related Video
Z-Statistics vs. T-Statistics EXPLAINED in 4 Minutes

Elementary Statistics - Chapter 7 - Estimating Parameters and Determining Sample Sizes Part 2
Student's T Distribution
The Central Limit Theorem, Clearly Explained!!!
Introduction to the t Distribution (non-technical)
6.4.1 The Central Limit Theorem - What the Central Limit Theorem Says and What It Doesn't Say
5.0 / 5 (0 votes)
Thanks for rating: