How to calculate linear regression using least square method
TLDRThis tutorial demystifies the process of regression analysis by guiding viewers through the basics of plotting data points, calculating means, and deriving the regression line equation step by step. The instructor simplifies the concept by explaining how to find the slope (B1) and y-intercept (B0) of the line, ensuring the regression line passes through the mean of the data points. The tutorial also touches on the R-squared value, which measures the effectiveness of the regression model in predicting outcomes, promising a continuation in the next video.
Takeaways
- 📈 The tutorial focuses on simplifying the concept of regression analysis by explaining the process step by step.
- 📊 The independent variable (X-axis) and dependent variable (Y-axis) are introduced with hypothetical data points being plotted.
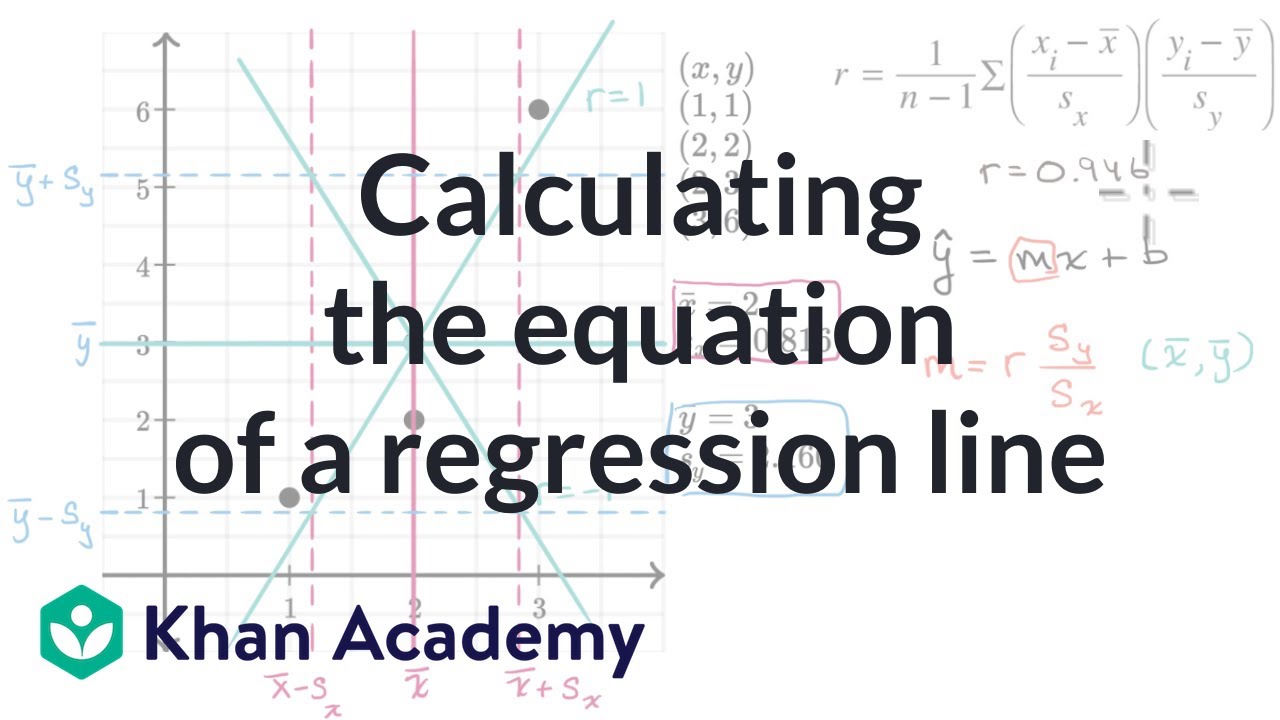
- 📍 The mean of the X values and the mean of the Y values are calculated to find the central point that all regression lines must pass through.
- 🔍 The distances of each data point from the mean of X and Y are calculated to prepare for determining the slope of the regression line.
- 📐 The slope (B1) of the regression line is determined by using the formula that involves the sum of the products of the differences from the mean of X and Y.
- 🧮 The numerator for calculating B1 is the sum of the product of (X - mean of X) and (Y - mean of Y), while the denominator is the sum of the squared differences of X from its mean.
- 📉 The y-intercept (B0) is found by using the regression line's requirement to pass through the point of means and solving for B0 in the equation Y = B0 + B1 * X.
- 🔑 The final equation of the regression line is presented as Y hat equals B0 plus B1 times X, with B0 being the y-intercept and B1 the slope.
- 🔍 The process of finding B1 and B0 is detailed, emphasizing the mathematical steps and the rationale behind each calculation.
- 📚 The tutorial promises to continue with an explanation of R-squared in the next video, which measures the proportion of variance in the dependent variable that is predictable from the independent variable.
- 🤓 The script aims to demystify regression analysis, making it accessible to viewers who may find the topic intimidating at first glance.
Q & A
What is the main topic of the tutorial?
-The main topic of the tutorial is regression analysis, focusing on understanding the process of creating a regression line using equations, numbers, and formulas.
What are the two types of variables discussed in the tutorial?
-The two types of variables discussed are the independent variable (X-axis) and the dependent variable (Y-axis).
How does the tutorial start the process of creating a regression line?
-The tutorial starts by plotting the independent and dependent variables on a graph, labeling the y-axis with observation points.
What is the significance of the mean of X values and Y values in the regression line?
-The mean of X values and Y values is significant because the regression line must pass through the point where the mean of the independent variable and the mean of the dependent variable intersect.
What does the tutorial mean by 'distance from the x value to the mean' in the context of regression?
-The 'distance from the x value to the mean' refers to the difference between each x value of the observations and the mean of the x values, which is used in the calculation of the regression line.
What is the formula for the estimated regression line?
-The formula for the estimated regression line is Y hat equals B naught plus B 1 times X, where Y hat is the estimated Y value, B naught is the y-intercept, B 1 is the slope, and X is the independent variable.
How is the slope (B1) of the regression line determined?
-The slope (B1) is determined by dividing the sum of the product of the differences between each X value and the mean of X, and the differences between each Y value and the mean of Y, by the sum of the squared differences between each X value and the mean of X.
What is the role of B naught in the regression equation?
-B naught represents the y-intercept of the regression line, which is the point where the line crosses the y-axis.
How does the tutorial find the y-intercept (B naught) after determining the slope (B1)?
-The tutorial finds the y-intercept (B naught) by using the point where the regression line must cross, which is at the mean of X and Y values, and solving for B naught in the regression equation.
What is R-squared and how does it relate to the tutorial?
-R-squared is a statistical measure that represents the proportion of the variance for a dependent variable that's explained by an independent variable or variables in a regression model. The tutorial mentions it as the next topic to be discussed, likely in relation to the distances between the regression line's estimated values and the actual values.
Outlines
📚 Introduction to Regression Analysis
The speaker introduces the concept of regression analysis, explaining that it involves creating equations with numbers and formulas that may seem complex at first. They aim to simplify the process by starting with the basics: plotting independent (X-axis) and dependent variables (Y-axis) on a graph. The tutorial includes plotting several observations, calculating the mean of X and Y values, and emphasizing the importance of the regression line passing through the point where the means of X and Y intersect.
📉 Calculating the Regression Line
This paragraph delves into the technical steps of calculating the regression line. The speaker explains how to find the slope (B1) of the line by using the differences between each X and Y observation and their respective means. They demonstrate the process of squaring these differences and multiplying them, summing them up to find the numerator and denominator for the slope calculation. The slope is determined to be 0.6. The y-intercept (B0) is then calculated using the regression line's requirement to pass through the mean point of X and Y. The final equation of the regression line is presented as Y hat equals 2.2 plus 0.6 times X.
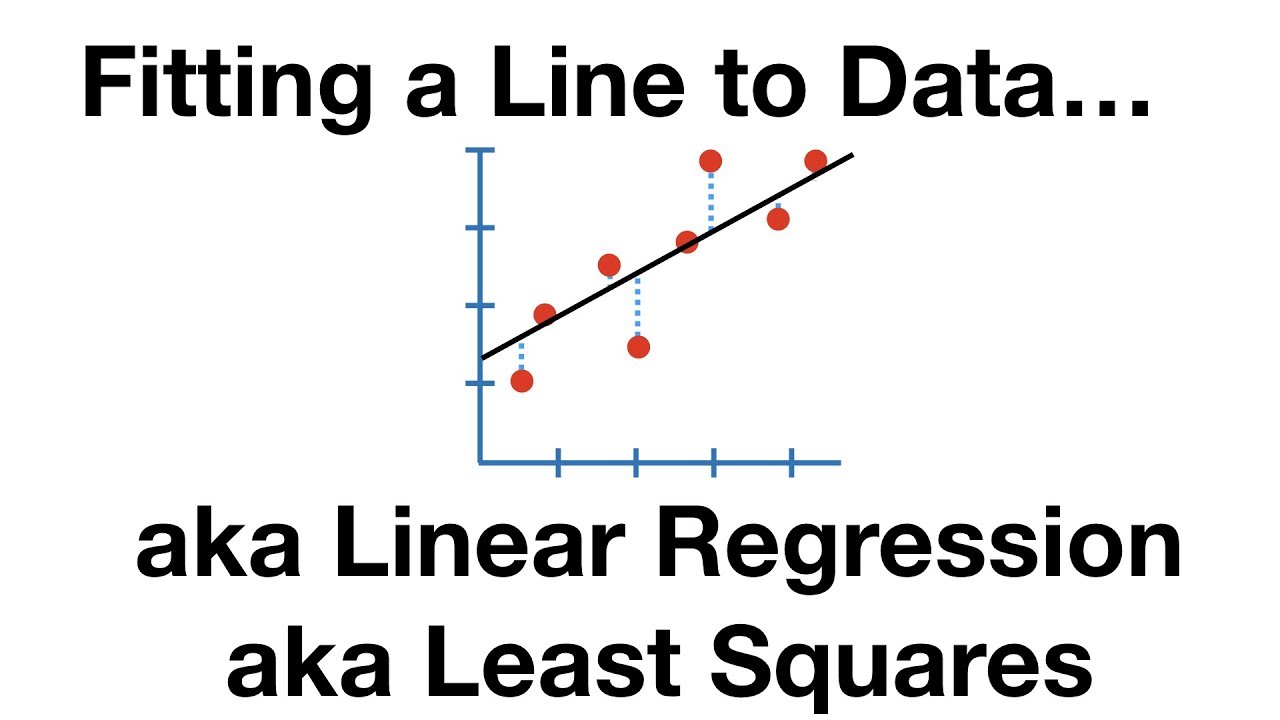
📈 Discussing R-Squared in Regression
The final paragraph introduces the concept of R-squared, which measures how well the regression line fits the data. The speaker plans to explain how R-squared is calculated by looking at the distances between the estimated regression line values and the actual observed values. The intention is to provide a clear and easy-to-understand explanation of this metric in the next video, which will continue the discussion on regression analysis.
Mindmap
Keywords
💡Regression
💡Independent Variable
💡Dependent Variable
💡Observations
💡Mean
💡Regression Line
💡Slope (B1)
💡Y-Intercept (B0)
💡R-Squared
💡Estimation
Highlights
Introduction to the concept of regression and its potential complexity.
Explanation of the independent variable (x-axis) and dependent variable (y-axis) in regression.
Demonstration of plotting data points for both x and y variables.
Identification of the first observation with coordinates (1, 2).
Process of plotting additional observations on the graph.
Calculation of the mean of x values and its significance in regression.
Calculation of the mean of y values and its importance in regression analysis.
Explanation of why all regression lines must pass through the mean of x and y values.
Method of calculating the distance of each observation from the mean for both x and y values.
Introduction to the regression equation and the variables B0 (y-intercept) and B1 (slope).
Calculation of the slope (B1) using the differences between x and y values from their respective means.
Determination of the y-intercept (B0) using the regression line's intersection with the y-axis.
Finalization of the regression equation with the calculated B0 and B1 values.
Introduction to the concept of R-squared and its role in measuring the fit of the regression line.
Explanation of how R-squared is calculated by comparing distances between estimated and actual values.
Anticipation of a follow-up tutorial on R-squared for further elaboration.
Transcripts
Browse More Related Video

Regression and R-Squared (2.2)
Calculating the equation of a regression line | AP Statistics | Khan Academy

10.2.2 Regression - Three Methods for Finding the Equation of the Regression Line

Pre-Calculus - Find the linear regression line using the TI-83/84 calculator (2)

Statistics 101: Linear Regression, The Least Squares Method
The Main Ideas of Fitting a Line to Data (The Main Ideas of Least Squares and Linear Regression.)
5.0 / 5 (0 votes)
Thanks for rating: