ANOVA 2: Calculating SSW and SSB (total sum of squares within and between) | Khan Academy
TLDRIn this educational video, the presenter breaks down the concept of total sum of squares, explaining how to calculate the variation within and between groups in a dataset. The script demonstrates the process of finding the sum of squares within groups by comparing each data point to its group mean, and the sum of squares between groups by comparing group means to the overall mean. The explanation includes the calculation of degrees of freedom for each component and shows how these components sum up to the total variation, providing a foundational understanding of Analysis of Variance (ANOVA).
Takeaways
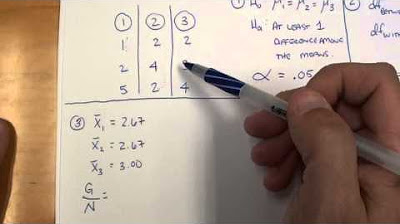
- 📊 The video script discusses the concept of calculating the total sum of squares for nine data points divided into three groups.
- 🔍 The aim is to differentiate between the total sum of squares due to variation within each group and the variation between the groups.
- 📈 The 'sum of squares within' is calculated by finding the squared differences between each data point and its group's mean, not the overall mean.
- 📝 The script provides a step-by-step calculation for the sum of squares within, using specific numerical examples from the data points.
- 🧩 The degrees of freedom for each group are calculated as the number of data points in the group minus one, reflecting the number of independent pieces of information.
- 🔢 The total degrees of freedom for the analysis is the sum of degrees of freedom for each group, which is also the product of the number of groups and the degrees of freedom per group.
- 📉 The 'sum of squares between' is calculated by finding the squared differences between each group's mean and the overall mean of means.
- 🌐 The script explains the concept of degrees of freedom in the context of the sum of squares between, which is the number of groups minus one.
- 🔄 The total sum of squares is the sum of the sum of squares within and the sum of squares between, reflecting the total variation in the data.
- 📚 The script emphasizes that the sum of squares within and between add up to the total sum of squares, which is a fundamental principle of analysis of variance (ANOVA).
- 📉 The degrees of freedom for the total sum of squares is the sum of the degrees of freedom within and between, which aligns with the total degrees of freedom for all data points.
Q & A
What is the main objective of the video?
-The main objective of the video is to explain how to calculate and differentiate between the total sum of squares and the sum of squares within and between groups in a dataset.
What does the term 'total sum of squares' refer to in the context of the video?
-The 'total sum of squares' refers to the overall measure of variation in a dataset, which includes the variation within each group and the variation between the groups.
How are the data points grouped in the video's example?
-The data points are grouped into three different groups, or m different groups in a general sense.
What is meant by 'sum of squares within' in the video?
-'Sum of squares within' is the measure of variation of each data point from the mean of its respective group.
Can you explain the process of calculating the sum of squares within as described in the video?
-The sum of squares within is calculated by taking the difference between each data point and its group's mean, squaring these differences, and then summing them up for all data points within the group.
What is the significance of calculating the sum of squares within and between in the video?
-Calculating the sum of squares within and between helps to understand the distribution of variation in the data, distinguishing between the variation that occurs within groups and the variation that occurs between group means.
How is the 'degrees of freedom' concept introduced in the video?
-The 'degrees of freedom' is introduced as the number of independent data points in a calculation, which is essentially the number of data points minus one for each group, reflecting the number of values that can vary freely.
What is the total degrees of freedom in the video's example, and how is it calculated?
-The total degrees of freedom in the example is 8, calculated as the sum of the degrees of freedom within each group (m times n minus 1) and the degrees of freedom between the groups (m minus 1).
What is the 'sum of squares between' and how is it calculated?
-The 'sum of squares between' measures the variation due to the differences between the group means and the overall mean. It is calculated by taking the difference between each group mean and the overall mean, squaring these differences, and summing them up.
What is the relationship between the total sum of squares, sum of squares within, and sum of squares between as shown in the video?
-The relationship is that the total sum of squares is equal to the sum of the sum of squares within and the sum of squares between, reflecting that the total variation in the data can be partitioned into variation within groups and variation between group means.
How does the video explain the concept of degrees of freedom in relation to the sum of squares between?
-The video explains that for the sum of squares between, the degrees of freedom is m minus 1, where m is the number of groups, since knowing the overall mean and the means of m-1 groups allows you to determine the mean of the remaining group.
Outlines
📊 Calculating Sum of Squares Within Groups
This paragraph introduces the concept of partitioning the total sum of squares into components that represent variation within and between groups. The focus is on calculating the sum of squares within each group, which measures how far each data point deviates from its group's mean. The process involves squaring the differences between individual data points and their respective group means and then summing these values. The example provided walks through the calculation for three groups, demonstrating how to find the sum of squares within, which is found to be 6 out of a total variation of 30. Additionally, the paragraph discusses the concept of degrees of freedom in the context of the data points within each group, explaining that for each group, knowing the sample mean and two data points allows the third to be determined, hence there are n-1 degrees of freedom per group.
🔍 Analyzing Variation Between Groups
The second paragraph delves into the analysis of variation between different groups or samples. It discusses calculating the sum of squares between groups, which is the variation attributed to the difference between each group's mean and the overall mean of means. The calculation involves squaring the differences between individual group means and the grand mean, then summing these values for all groups. The example provided illustrates this process for three groups, resulting in a sum of squares between of 24. The paragraph also explains the degrees of freedom associated with this calculation, noting that knowing the overall mean and two group means allows the third to be inferred, hence there are m-1 degrees of freedom for the variation between groups.
🧩 Piecing Together the Analysis of Variance
The final paragraph synthesizes the previous discussions on the sum of squares within and between groups, highlighting the relationship between these components and the total sum of squares. It emphasizes that the total variation in the dataset can be viewed as the sum of variation within groups and variation between group means. The paragraph also confirms that the degrees of freedom for the sum of squares within (m times n minus m) and between (m minus 1) add up to the total degrees of freedom for the dataset (mn minus 1). This synthesis illustrates the foundational principles of analysis of variance, setting the stage for hypothesis testing in future discussions.
Mindmap
Keywords
💡Total Sum of Squares
💡Groups
💡Variation Within
💡Central Tendency
💡Degrees of Freedom
💡Sum of Squares Within
💡Sample Mean
💡Mean of Means
💡Sum of Squares Between
💡Analysis of Variance (ANOVA)
Highlights
Introduction of the concept of calculating the total sum of squares for nine data points grouped into three different groups.
Objective to determine the proportion of total sum of squares attributed to within-group and between-group variations.
Explanation of 'sum of squares within' and its calculation based on the deviation of data points from their group mean.
Demonstration of the calculation process for sum of squares within using specific data points and their respective group means.
Clarification on the method of squaring the differences between each data point and its group mean for the sum of squares within.
Result of the sum of squares within calculation, which equals 6, representing a part of the total variation.
Introduction of the concept of degrees of freedom in the context of independent data points.
Calculation of degrees of freedom for each group based on the number of data points minus one.
Total degrees of freedom calculation considering all groups and their respective degrees of freedom.
Transition to calculating the sum of squares between groups to understand variation due to group means.
Methodology for calculating sum of squares between by squaring the difference between each group mean and the overall mean.
Result of the sum of squares between calculation, which equals 24, indicating variation between group means.
Introduction of the concept of degrees of freedom for the sum of squares between, which is m minus 1.
Calculation of the total degrees of freedom for the entire dataset, combining within and between group degrees of freedom.
Reveal that the sum of squares within plus the sum of squares between equals the total sum of squares.
Explanation of how the degrees of freedom for the total, within, and between sum of squares align perfectly.
Conclusion emphasizing the decomposition of total variation into within-sample and between-sample components.
Highlighting the importance of this analysis in understanding the distribution of variation in data for hypothesis testing.
Transcripts
Browse More Related Video

ANOVA 1: Calculating SST (total sum of squares) | Probability and Statistics | Khan Academy

How to Calculate ANOVA with Excel (Analysis of Variance)

ANOVA: One-way analysis of variance

How To Calculate and Understand Analysis of Variance (ANOVA) F Test.
One Way ANOVA
ANOVA (Analysis of Variance) and Sum of Squares | Statistics Tutorial #26 | MarinStatsLectures
5.0 / 5 (0 votes)
Thanks for rating: