ANOVA 1: Calculating SST (total sum of squares) | Probability and Statistics | Khan Academy
TLDRThis video script introduces the concept of the total sum of squares (SST) in the context of analysis of variance. It demonstrates the calculation of the grand mean from a dataset and uses it to compute the SST by summing the squared differences between each data point and the mean. The script also explains the relationship between the grand mean and the mean of means, and hints at the degrees of freedom in variance calculation. The aim is to provide an intuitive understanding of variance analysis, setting the stage for further exploration of within-group and between-group variance in subsequent videos.
Takeaways
- 📚 The video series will focus on calculations related to a specific dataset to develop an intuitive understanding of Analysis of Variance (ANOVA).
- 📊 The first calculation introduced is the Total Sum of Squares (SST), which is akin to the numerator in variance calculations without dividing by degrees of freedom.
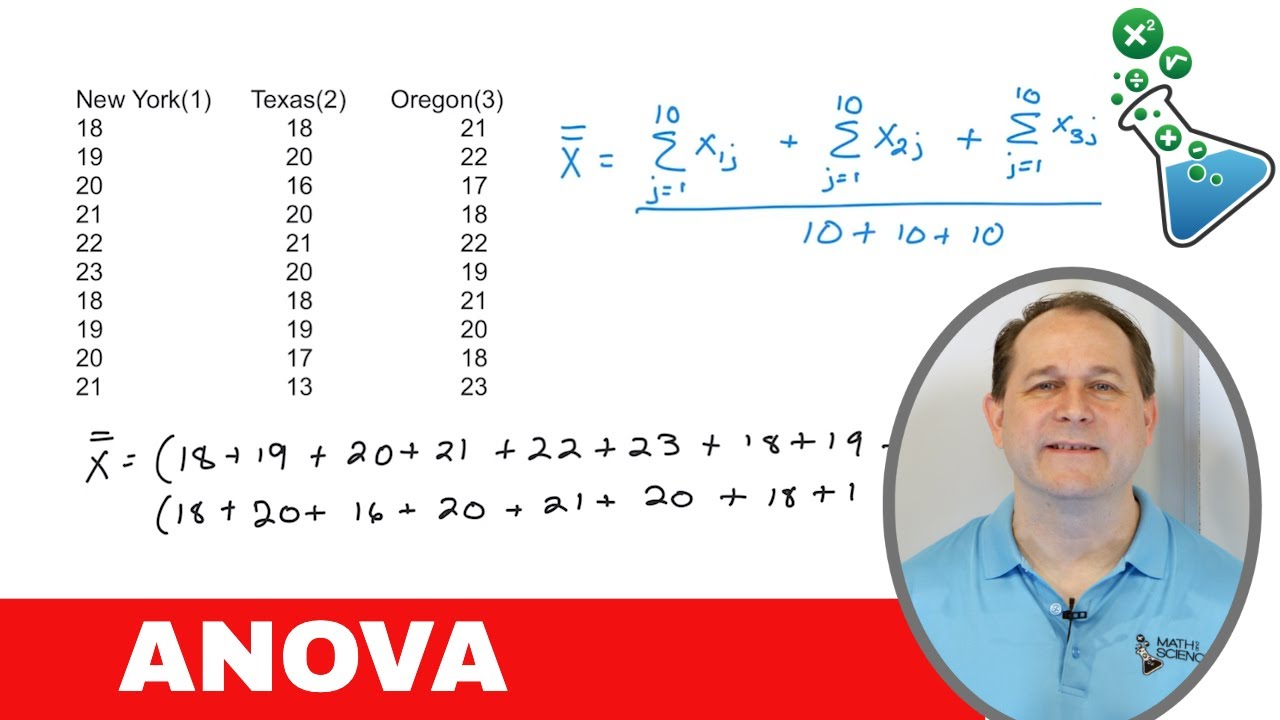
- 🧮 To find the grand mean, sum all data points and divide by the total number of data points, which in this case is 9, resulting in a grand mean of 4.
- 🔢 The grand mean can also be calculated by finding the mean of the means of individual groups, which also equals 4 in this example.
- 📈 The process of calculating the Total Sum of Squares involves taking each data point, subtracting the grand mean, squaring the result, and summing these values.
- 🔍 The script demonstrates the calculation of the Total Sum of Squares with specific numerical examples, resulting in a total of 30.
- 📉 Degrees of freedom in this context are the total number of data points minus 1, which is 8 for the dataset discussed in the script.
- 🔑 Understanding the concept of degrees of freedom is crucial as it is used to calculate the variance by dividing the Total Sum of Squares by these degrees of freedom.
- 🌐 The script hints at the upcoming discussion of variance components, dividing the total variance into within-group and between-group variances.
- 📝 The video aims to provide intuition behind statistical formulas without rigorous proof, focusing on the conceptual understanding of ANOVA.
- 🚀 The final goal is to understand how the total variance of a sample can be attributed to variance within groups versus variance between groups, setting the stage for further ANOVA analysis.
Q & A
What is the main focus of the video and subsequent videos?
-The main focus is to perform calculations on a given dataset to develop an intuitive understanding of the analysis of variance.
What does the acronym SST stand for?
-SST stands for Total Sum of Squares, which is a measure used in the analysis of variance.
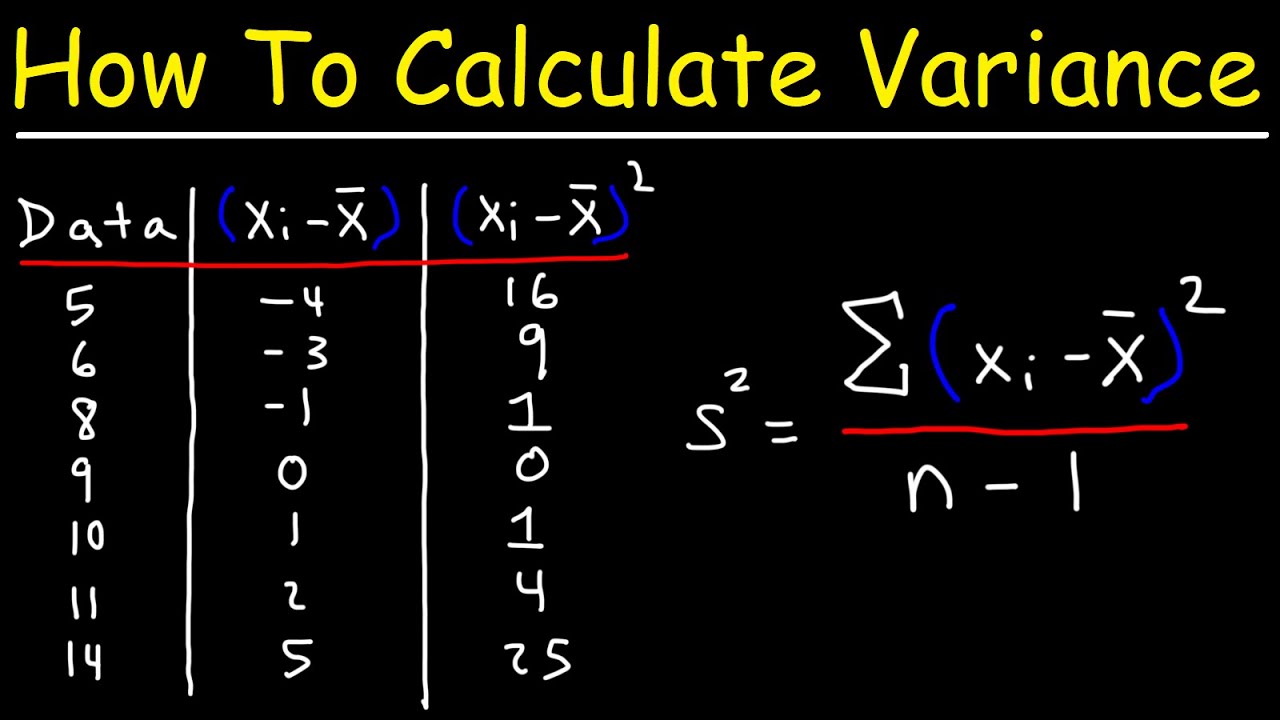
How is the Total Sum of Squares (SST) calculated?
-SST is calculated by taking the difference between each data point and the mean of all data points, squaring these differences, and then summing them up.
What is the difference between calculating the Total Sum of Squares and sample variance?
-The difference is that for the Total Sum of Squares, you do not divide by the degrees of freedom as you would when calculating the sample variance.
What is the grand mean and how is it calculated?
-The grand mean is the mean of all data points in the dataset. It is calculated by summing all the data points and dividing by the total number of data points.
Why is the grand mean also referred to as the mean of the means?
-The grand mean is referred to as the mean of the means because it can be calculated by taking the mean of each group's mean and then finding the mean of these group means.
What is the significance of the degrees of freedom in the context of variance calculation?
-The degrees of freedom represent the number of independent pieces of information available to estimate the variance. It is calculated as the total number of data points minus one.
How many data points are there in the dataset used in the video?
-There are a total of nine data points in the dataset.
What is the calculated grand mean of the dataset in the video?
-The calculated grand mean of the dataset is 4.
What is the Total Sum of Squares (SST) for the dataset in the video?
-The Total Sum of Squares for the dataset is 30.
How does the video script relate to the concept of analysis of variance?
-The script is introducing the concept of analysis of variance by breaking down the total variance into components that come from within groups and between groups, showing how these components add up to the total sum of squares.
Outlines
📊 Introduction to Analysis of Variance (ANOVA)
This paragraph introduces the concept of Analysis of Variance (ANOVA) through a series of calculations on a given dataset. The focus is on calculating the Total Sum of Squares (SST), which is akin to the numerator in variance calculations. The presenter explains the process of finding the grand mean, which is the average of all data points and is also the mean of the means of individual groups within the dataset. The calculation involves summing up all the data points and dividing by the total number of points, which in this case is 9, resulting in a grand mean of 4. The presenter also demonstrates that the grand mean is the same as the mean of the individual group means, which is an important concept in understanding ANOVA.
🔍 Understanding Degrees of Freedom and Variance
The second paragraph delves into the concept of degrees of freedom in the context of statistical analysis, specifically in relation to variance calculations. The presenter explains that with m groups, each containing n members, the total number of members is m times n. In this example, there are 9 members in total. Degrees of freedom are calculated as the total number of data points minus one, which in this case is 8, because knowing the mean of means allows for the calculation of any single data point from the others. The presenter then discusses how variance would be calculated by dividing the total sum of squares by the degrees of freedom, which for this dataset would be 30 divided by 8. The paragraph concludes with an introduction to the next part of the analysis, which will involve breaking down the total variance into components that come from within groups and between groups, setting the stage for a deeper understanding of ANOVA.
Mindmap
Keywords
💡Analysis of Variance (ANOVA)
💡Total Sum of Squares (SST)
💡Grand Mean
💡Mean of Means
💡Degrees of Freedom
💡Variance
💡Data Points
💡Group Variation
💡Within-Group Variation
💡Between-Group Variation
Highlights
Introduction to a series of videos on calculations related to a dataset to understand the concept of analysis of variance.
Calculation of the total sum of squares (SST) as the numerator when calculating variance.
Explanation of the process to calculate the grand mean of the dataset.
Demonstration that the grand mean is the same as the mean of the means of each dataset.
Calculation of the grand mean by summing all data points and dividing by the total number of data points.
Illustration of how to calculate the mean of each individual group.
Verification that the calculated grand mean matches the mean of the means of the groups.
Introduction to the calculation of the total sum of squares using the grand mean.
Methodology for calculating the total sum of squares by squaring the difference between each data point and the grand mean.
Detailed calculation of the total sum of squares with specific values.
Explanation of the degrees of freedom in the context of calculating variance.
Concept of degrees of freedom as the number of independent measurements in the dataset.
Calculation of variance by dividing the total sum of squares by the degrees of freedom.
Introduction to the next video's focus on partitioning the total variance into within-group and between-group variance.
Conceptual explanation of how variance can be attributed to differences within and between groups.
Anticipation of the upcoming demonstration of how total variance is the sum of within-group and between-group variance.
Transcripts
Browse More Related Video

ANOVA 2: Calculating SSW and SSB (total sum of squares within and between) | Khan Academy
ANOVA: One-way analysis of variance
How To Calculate Variance
13 - ANOVA Basics - The Grand Mean
What is Variance in Statistics? Learn the Variance Formula and Calculating Statistical Variance!
Find the Mean, Variance, & Standard Deviation of Frequency Grouped Data Table| Step-by-Step Tutorial
5.0 / 5 (0 votes)
Thanks for rating: