BEST CALCULATOR HACKS (SAT, ACT, etc.)
TLDRIn this educational video, Sophie introduces viewers to a variety of calculator tricks tailored for students preparing for standardized tests like the PSAT, SAT, and ACT, as well as for general math classes. She demonstrates how to use the equation solver, graphing strategies, finding zeros of equations, simplifying fractions, and handling logarithms with custom bases on a TI-84 Plus calculator. Additionally, she covers derivative calculations, binomial probability, storing values for quick substitution, and plotting graphs to visually interpret data. The video is a valuable resource for those seeking to enhance their mathematical problem-solving skills and efficiency.
Takeaways
- 📚 Sophie introduces a series of calculator tricks for the PSAT, SAT, ACT, and general math classes, specifically using the TI-84 Plus model.
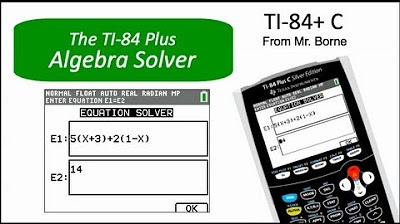
- 🔍 The 'Equation Solver' feature is highlighted as a powerful tool for solving equations, including quadratic formulas, by setting them equal to zero and guessing a value to find the roots.
- 📈 The importance of graphing equations is emphasized as a strategy to find intersections or zeros, which can be especially useful for complex problems.
- 🔢 Sophie demonstrates how to find the zeros of an equation using the 'trace' function on the calculator for a more precise solution than manual counting.
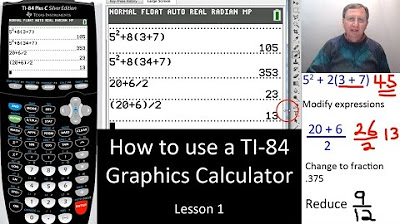
- ➗ The 'Fraction' button is introduced as a convenient way to simplify the addition of multiple fractions into a single fraction without manually finding a common denominator.
- 📚 The 'Log Base' feature allows for the calculation of logarithms with custom bases, which can be particularly useful for problems not based on the default base 10 or e.
- 📈 The 'Derivative' function is explained as a way to find the slope of a function at a specific point, which can be helpful for understanding rates of change.
- 🎲 The 'Binomial PDF' function is mentioned for calculating probabilities in specific scenarios, like the chance of making a certain number of free throws.
- 💡 The 'Storing' function is shown as a simple trick for guess and check methods, allowing users to store a value and easily plug it into equations for quick checks.
- 📊 Sophie explains how to manually plot graphs on the calculator using 'Stat' and 'Plot' features, which can be beneficial for visual learners or when equations are not provided.
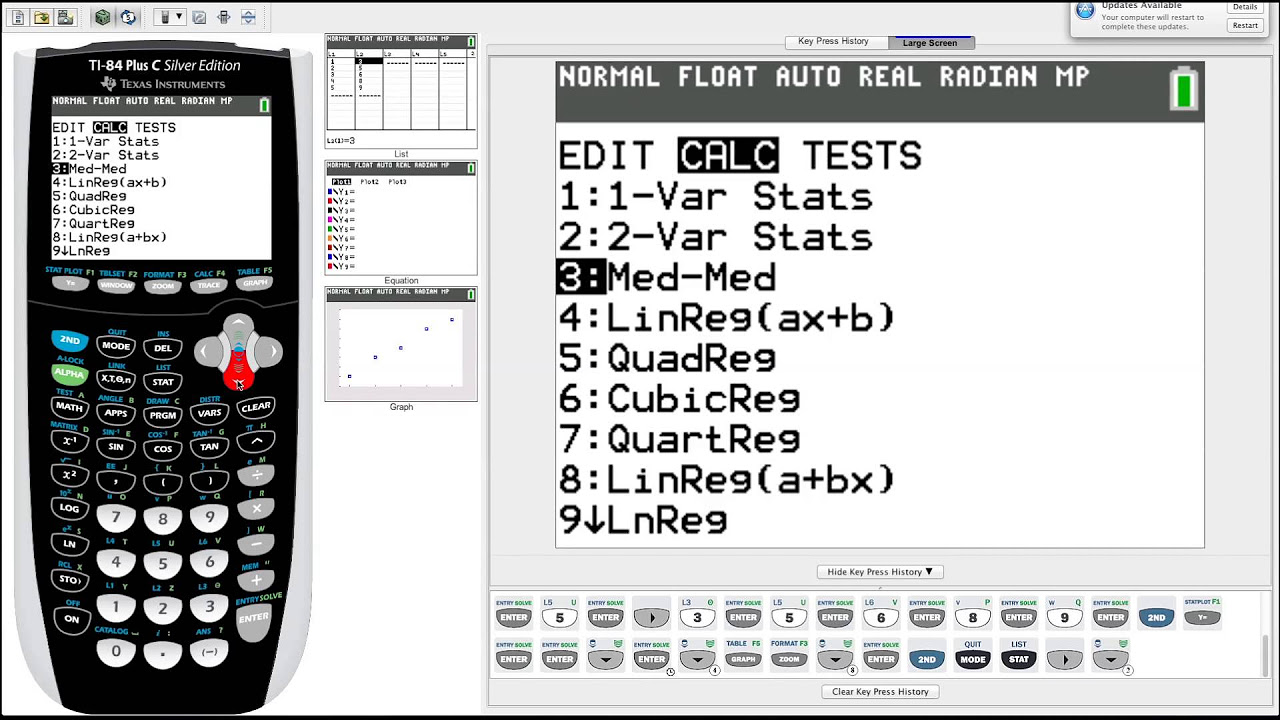
- 🧬 The 'Linear Regression' tool is introduced to find the equation of a line from a set of points, useful for understanding trends and patterns in data.
Q & A
What is the main topic of Sophie's video?
-The main topic of Sophie's video is to demonstrate various calculator tricks that can be useful for the PSAT, SAT, ACT, and general math classes.
What type of calculator does Sophie use in the video?
-Sophie uses the TI-84 Plus calculator in the video, which is a standard calculator in many schools, especially in Texas.
How does Sophie access the equation solver on her calculator?
-Sophie accesses the equation solver by going to the 'Math' menu, then selecting 'Alpha', followed by 'Apps', and then choosing the equation solver option.
What is the purpose of the 'Zero' function on the calculator?
-The 'Zero' function on the calculator is used to find the zeros of an equation, which can also be the solutions to the equation.
How does the 'Fraction' button help in solving math problems?
-The 'Fraction' button helps in simplifying complex fractions by automatically calculating a common denominator and providing a simplified fraction as the result.
What is the advantage of using the 'Log Base' function on the calculator?
-The 'Log Base' function allows users to calculate logarithms with a custom base, which can be particularly useful when the base is not the default 10 or e (Euler's number).
What does Sophie mean by 'When in doubt, graph it out'?
-Sophie suggests that when faced with complex math problems, especially those involving equations and their intersections, graphing them out can provide a visual solution and make the problem easier to understand.
How can the 'Derivative' function be used in the calculator?
-The 'Derivative' function can be used to find the slope of a function at a specific point, which is useful for understanding the rate of change at that point.
What is the 'Binomial PDF' function used for?
-The 'Binomial PDF' function is used to calculate the probability of a certain event occurring a specific number of times in a given number of trials, which can be useful in statistics and probability problems.
How does the 'Store' function help in solving equations?
-The 'Store' function allows users to store a specific value for a variable, which can then be easily plugged into equations for quick calculations, making it a useful tool for guess and check methods.
What is the process of plotting graphs on the calculator as described by Sophie?
-Sophie describes plotting graphs by entering values into the L1 (x-values) and L2 (y-values) lists, then activating the plot and using the graphing function to visually represent the data.
How can the calculator find the equation of a line from plotted points?
-The calculator can perform a linear regression analysis by using the 'Stat' then 'Calc' functions, selecting 'LinReg' (linear regression), and inputting the appropriate lists for x and y values to find and display the equation of the line.
Outlines
📚 Introduction to Calculator Tricks for Math Tests
Sophie introduces a video tutorial on useful calculator tricks for exams like the PSAT, SAT, and ACT, as well as for general math class. She mentions that the video will cover a range of tips using the TI-84 Plus calculator, which is standard in many schools, and assures that even without this specific model, viewers can apply the concepts on other calculators. The video kicks off with the equation solver feature, a tool for solving equations set equal to zero, including quadratic formulas, by inputting the equation and using the calculator's guess-and-check method to find the solution.
📈 Utilizing Graphing for Problem Solving
The second paragraph discusses the strategy of graphing equations to solve problems, especially when dealing with systems of equations or finding intersections. Sophie demonstrates how to use the graphing function on the calculator to visualize where two equations intersect, which can also be used to find zeros of a parabola. She introduces the 'trace' function to find exact values of intersections or zeros, emphasizing its utility in various math problems, including those that may appear on standardized tests.
🔢 Calculator Functions for Fractions and Logarithms
Sophie explains how to simplify the process of adding fractions using the calculator's fraction button, which automatically computes a common denominator and sums the fractions into a single simplified form. She also covers the use of logarithms, including changing the base of the logarithm from the default base 10 or natural log (base e) to a custom base using the calculator's settings. This feature is particularly helpful for solving logarithmic equations that require a non-standard base.
📊 Derivatives and Binomial PDFs in Calculus
The fourth paragraph covers the use of the derivative function on the calculator to find the slope of a tangent line at a specific point on a curve, which can be useful for understanding rates of change. Sophie also introduces the binomial PDF function, which calculates the probability of a certain number of successes in a given number of trials, using an example of free-throw shooting to illustrate how to use the function to determine the likelihood of making a specific number of shots.
🔍 Storing Values and Plotting Graphs
Sophie demonstrates how to store values in the calculator for quick use in equations, a feature that simplifies the process of 'guess and check' or plugging in multiple values. She also explains how to plot graphs manually using data points, which can be particularly useful for visual learners or for those who need to understand the trend of a function. Additionally, she shows how to perform linear regression to find the equation of a line that best fits a set of points, a technique that can be applied to various types of mathematical modeling.
Mindmap
Keywords
💡Calculator Tricks
💡TI-84 Plus
💡Equation Solver
💡Graphing
💡Zeros of an Equation
💡Fraction Button
💡Logarithms
💡Derivative
💡Binomial PDF
💡Storing Values
💡Plotting Graphs
💡Linear Regression
Highlights
Introduction to calculator tricks for standardized tests like PSAT, SAT, and ACT.
Use of the TI-84 Plus calculator as a standard tool in Texas schools and for SAT and ACT exams.
Demonstration of the equation solver feature on the TI-84 Plus for solving equations set equal to zero.
Explanation of how to access and use the equation solver with a step-by-step guide.
Strategy for graphing equations to find intersections or zeros when in doubt.
Using the trace function to find exact zeros of a parabola on a graph.
The fraction button's utility for simplifying complex fractions on the calculator.
Custom log base feature for solving logarithmic problems not based on the default 10 or e.
Derivative function to find the slope of a point on a line for potential SAT or ACT questions.
Binomial PDF function for calculating probabilities in specific scenarios.
Storing values in the calculator for quick plug-and-chug in equations.
Plotting graphs manually using the calculator for visual learners or to visualize functions.
Utilizing linear regression to find the equation of a line from plotted points.
The ability to store and graph equations for quick reference and solving.
Offer to create more videos explaining calculator tricks and working through problems.
Announcement of upcoming content related to college application reactions and ACT science.
Transcripts
Browse More Related Video


5.0 / 5 (0 votes)
Thanks for rating: