9.2.5 Two Means, Indep. Samples - Three Additional Cases for Hypothesis Tests, Confidence Intervals
TLDRThis educational video script delves into alternate statistical methods for testing claims about two population means using independent random samples. It focuses on three scenarios where the population standard deviations are unknown but assumed equal, known, or one is known while the other is not. The script explains the concept of pooling variances, adjusting formulas, and using z-scores or t-scores for hypothesis testing and constructing confidence intervals. It highlights the importance of assumptions and the practicality of methods, with a special note on the commonality of assuming equal population variances in similar group studies.
Takeaways
- 📚 The video discusses alternate methods for testing claims about two population means using independent random samples when the population standard deviations are unknown.
- 🔍 It covers the p-value method, critical value method, and confidence interval method, which are applicable when the population standard deviations are not assumed to be equal.
- 🧩 The script outlines modifications to these methods when certain conditions are not met, such as when the population standard deviations are unknown but assumed to be equal.
- 🔄 In the case of equal population standard deviations, the video introduces the concept of 'pooling the variances' to compute a pooled estimate of the population variance, denoted as \( s_p^2 \).
- 🎯 Pooling variances is advantageous as it increases the number of degrees of freedom, enhancing the power of the hypothesis test and narrowing the confidence intervals.
- 📉 The test statistic formula changes when assuming equal population standard deviations, using the pooled variance instead of separate variances for each sample.
- 📝 The number of degrees of freedom in the hypothesis test is calculated differently when pooling variances, being the sum of the sample sizes minus two.
- 📊 The video also briefly mentions the rare case where both population standard deviations are known, suggesting the use of z-scores instead of t-scores.
- 📌 A third scenario is discussed where one population standard deviation is known and the other is unknown, requiring adjustments in the test statistic and degrees of freedom.
- 🚫 The script notes that it's uncommon to know the population standard deviations, making the methods for unknown standard deviations the most frequently used.
- 🔑 The takeaway emphasizes the importance of confirming the assumption of equal population standard deviations before applying the pooling method, suggesting further analysis beyond the class scope.
Q & A
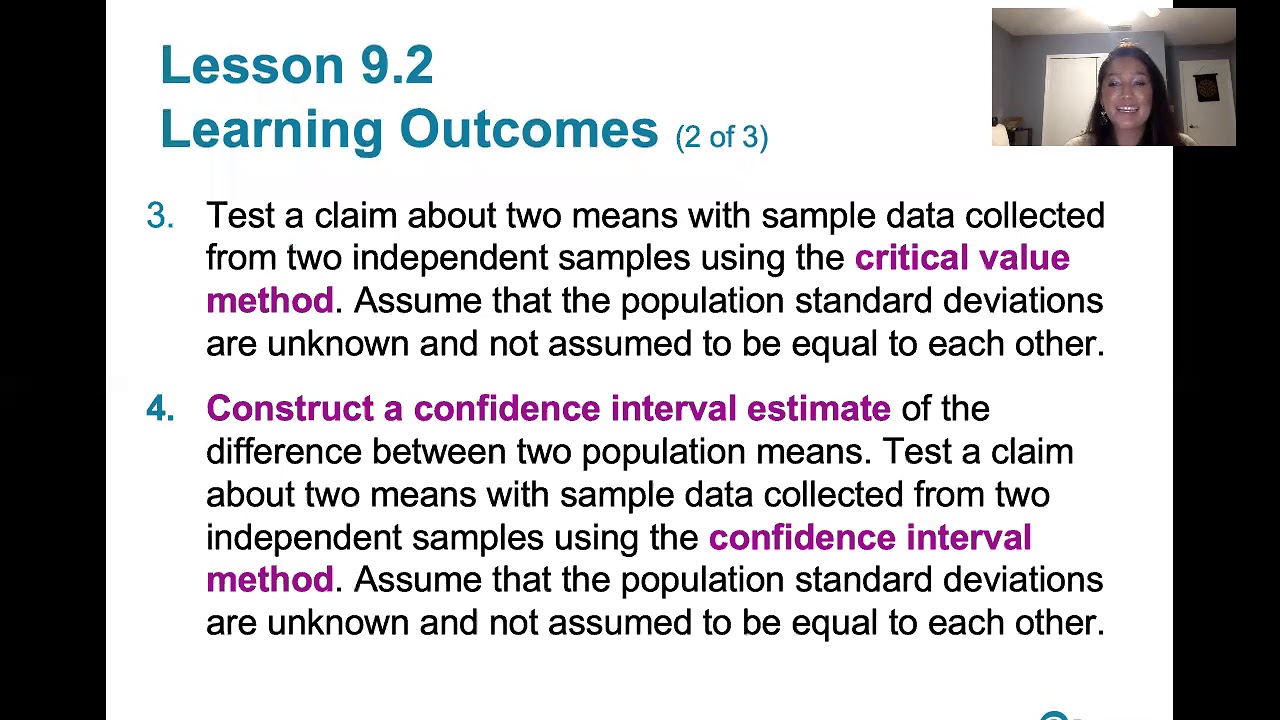
What is the main topic of Lesson 9.2, Learning Outcome Number Five?
-The main topic is alternate methods for testing a claim about two population means when the sample data are from two independent random samples.
What methods were previously discussed for testing claims about two population means?
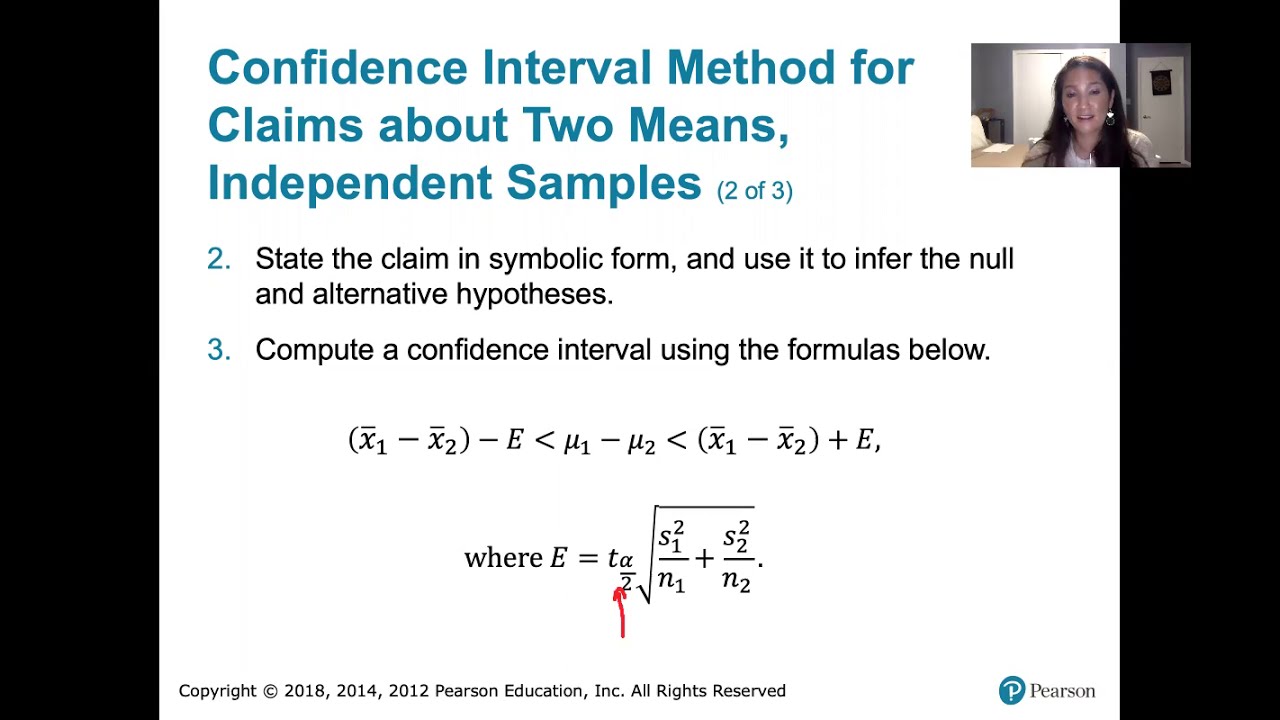
-The previously discussed methods are the p-value method, the critical value method, and the confidence interval method.
In what scenario would you use the pooled estimate of the population variance?
-You would use the pooled estimate of the population variance when the population standard deviations are unknown but assumed to be equal.
What is the advantage of pooling the variances?
-Pooling the variances increases the number of degrees of freedom, which gives the hypothesis test more power and results in narrower confidence intervals.
How is the pooled sample variance calculated?
-The pooled sample variance is calculated as a weighted average of the two sample variances, considering the sample sizes minus one for each sample.
What changes in the test statistic when the population standard deviations are assumed to be equal?
-When population standard deviations are assumed to be equal, the test statistic uses the pooled sample variance instead of the individual sample variances.
Why is knowing both population standard deviations considered a rare situation?
-It's rare because in most practical situations, we do not have knowledge of the population standard deviations, especially when estimating the difference between population means.
How does the test statistic change when both population standard deviations are known?
-When both population standard deviations are known, the test statistic is a z-score, and the standard normal distribution is used instead of the student t-distribution.
What is the approach when one population standard deviation is known and the other is unknown?
-When one population standard deviation is known, you use that known value and the appropriate student t-distribution with a modified formula for degrees of freedom.
Which situation among the three additional cases is relatively common and why?
-The relatively common situation is when the population standard deviations are assumed to be equal, as often seen with treatment and placebo groups drawn from the same population.
Outlines
📚 Pooling Variances for Equal Population Standard Deviations
This paragraph introduces the concept of pooling variances when testing a claim about two population means, assuming the population standard deviations (σ1 and σ2) are equal. The method is appropriate when the samples are from the same population, such as in randomized controlled trials with treatment and placebo groups. The key formula introduced is the pooled estimate of the population variance (sp²), which is a weighted average of the two sample variances. This approach results in a higher number of degrees of freedom, increasing the test's power and narrowing the confidence intervals, thus providing a more precise estimate of the difference between the population means (μ1 - μ2).
📐 Degrees of Freedom and Test Statistic Adjustments
The second paragraph delves into the specifics of calculating the number of degrees of freedom for the hypothesis test, which is the sum of the sample sizes minus two. It discusses the use of the test statistic 't' with this adjusted degrees of freedom. The paragraph also addresses the construction of confidence intervals for the difference between population means under the assumption of equal population standard deviations. The common value for the population variance is estimated using the pooled sample variance, and the standard normal distribution is used when both population standard deviations are known. However, the latter situation is rare, and the primary focus is on the use of the student t-distribution for hypothesis testing and confidence interval construction.
🔍 Situations with Known and Unknown Population Standard Deviations
The final paragraph outlines three additional cases for testing claims about two population means when dealing with unknown or known standard deviations. The first common situation is when the population standard deviations are assumed equal, which was discussed in the previous paragraphs. The second rare situation is when both population standard deviations are known, which allows for the use of z-scores instead of t-scores. The third situation is when one population standard deviation is known and the other is not, requiring adjustments to the test statistic and degrees of freedom. The paragraph emphasizes that the methods discussed in previous lessons are most commonly used, and these additional situations are presented for completeness, with the first being the most likely to occur in practice.
Mindmap
Keywords
💡Population Standard Deviation
💡Pooling Variances
💡Degrees of Freedom
💡Test Statistic
💡Hypothesis Testing
💡Confidence Interval
💡Margin of Error
💡P-Value Method
💡Critical Value Method
💡Student's t-Distribution
💡Standard Normal Distribution
Highlights
Discusses alternate methods for testing a claim about two population means using two independent random samples.
Covers the p-value method, critical value method, and confidence interval method for cases when population standard deviations are unknown and not assumed to be equal.
Outlines modifications to these methods when conditions are not met.
Introduces the first case where population standard deviations are unknown but assumed to be equal, using pooled variances.
Pooling variances requires the same conditions as before, but the formulas change to compute the pooled estimate of population variance, denoted as s sub p squared.
Provides an example of pooling variances when randomly assigning subjects to treatment and placebo groups.
Pooling variances increases the number of degrees of freedom, enhancing the hypothesis test's power and narrowing confidence intervals.
Describes the test statistic formula for pooled variances and its advantages.
Emphasizes that pooling variances is only appropriate if population standard deviations are assumed to be equal.
Explains the pooled sample variance calculation and its application.
Mentions the second situation, where population standard deviations are known, which is very rare.
In cases where population standard deviations are known, z-scores replace t-scores, and standard normal distribution is used.
The third situation involves one known and one unknown population standard deviation, with slight formula adjustments.
Summarizes that the previously discussed methods are typically the most applicable.
Encourages confirming the assumption that population standard deviations are equal using methods beyond the class scope.
Transcripts
Browse More Related Video
9.2.0 Two Means, Independent Samples - Lesson Overview, Learning Outcomes, Key Concepts

math 119 Chapter 9 part 2
9.2.2 Two Means, Independent Samples - The Rationale Behind The Equivalent Methods, P-value Method

Elementary Stats Lesson # 21
9.2.4 Two Means, Indep. Samples - Confidence Intervals, St. Deviations Unknown, Not Assumed Equal
One Way ANOVA (Analysis of Variance): Introduction | Statistics Tutorial #25 | MarinStatsLectures
5.0 / 5 (0 votes)
Thanks for rating: