Elementary Stats Lesson #22
TLDRThis educational video script covers statistical inference procedures for comparing two means using independent samples. It explains the conditions for conducting such analyses, including simple random sampling and normality. The script guides through hypothesis testing and constructing confidence intervals for the difference between two population means, using examples like state quarters' weight and resting pulse rates. It also highlights the difference between manual calculations using a conservative approach and calculator outputs, emphasizing the importance of understanding when to use each method.
Takeaways
- 📚 The lesson focuses on statistical inference for comparing two means using independent samples, where the samples cannot be paired.
- 🔍 The scenario typically involves comparing two treatments or characteristics across two different populations.
- 📈 The conditions for two-sample problems include simple random sampling, independence of samples, and approximately normal populations or large enough sample sizes (n1 ≥ 30 and n2 ≥ 30).
- 🌰 An example provided involves comparing the mean weight of state quarters to traditional quarters, with different sample sizes and no logical way to pair the samples.
- 📝 The process involves calculating summary statistics for each sample, including the sample mean, standard deviation, and sample size.
- 🧐 To test a claim about the difference between two means, a t-test is used, with a test statistic calculated using the difference between sample means and a standard error estimate.
- 📉 The p-value is determined to make a decision about the hypothesis, comparing it to the significance level (alpha), with a common level being 5%.
- 📊 Both box plots and t-distribution tables are used to visualize and calculate probabilities associated with the test statistic.
- 🔢 The use of a calculator or statistical software simplifies the process, particularly in calculating exact degrees of freedom and p-values.
- 🛠️ A confidence interval for the difference between two means is constructed using a similar approach, with a point estimate, critical value, and standard error estimate.
- 📋 The script concludes with a reminder of the importance of understanding when to use calculator outputs versus manual calculations, especially regarding degrees of freedom and critical values.
Q & A
What is the main focus of the lesson in the provided transcript?
-The main focus of the lesson is to conduct inference, specifically confidence intervals and hypothesis tests, for comparing two treatments or populations using independent samples.
Why are the samples considered independent in this context?
-The samples are considered independent because the individuals in one sample do not influence and have nothing to do with the individuals in the other sample.
What are the three conditions required for these two sample problems?
-The three conditions are: simple random sampling, independence in the samples, and approximately normal populations or samples that are large enough (n1 and n2 at least 30).
What is the example used in the transcript to illustrate the two-sample problem?
-The example used is a researcher wanting to know whether state quarters have a mean weight that is more than traditional quarters, comparing the weights of 18 state quarters and 16 traditional quarters.
How does the researcher plan to analyze the data from the state and traditional quarters?
-The researcher plans to use statistical methods, including t-tests and confidence intervals, to analyze the data and determine if there is a significant difference in the mean weight between state and traditional quarters.
What is the formula for the test statistic used in comparing two independent sample means?
-The formula for the test statistic is (x̄₁ - x̄₂) - 0 / [√(s₁²/n₁ + s₂²/n₂)], where x̄₁ and x̄₂ are the sample means, s₁ and s₂ are the sample standard deviations, and n₁ and n₂ are the sample sizes.
What is the significance of the p-value in hypothesis testing?
-The p-value is the probability of getting a test statistic as extreme as, or more extreme than, the one observed, assuming the null hypothesis is true. It helps decide whether to reject the null hypothesis.
How does the calculator program calculate the degrees of freedom for a two-sample t-test?
-The calculator program uses a more complex formula to determine the true degrees of freedom for a two-sample t-test, which is not limited to the conservative approach of using the smaller sample size minus one.
What is the difference between using the t-table and the calculator for determining the p-value in a two-sample t-test?
-The t-table requires a conservative approach to determine the degrees of freedom and provides an approximate p-value range, while the calculator uses the exact degrees of freedom and provides a precise p-value.
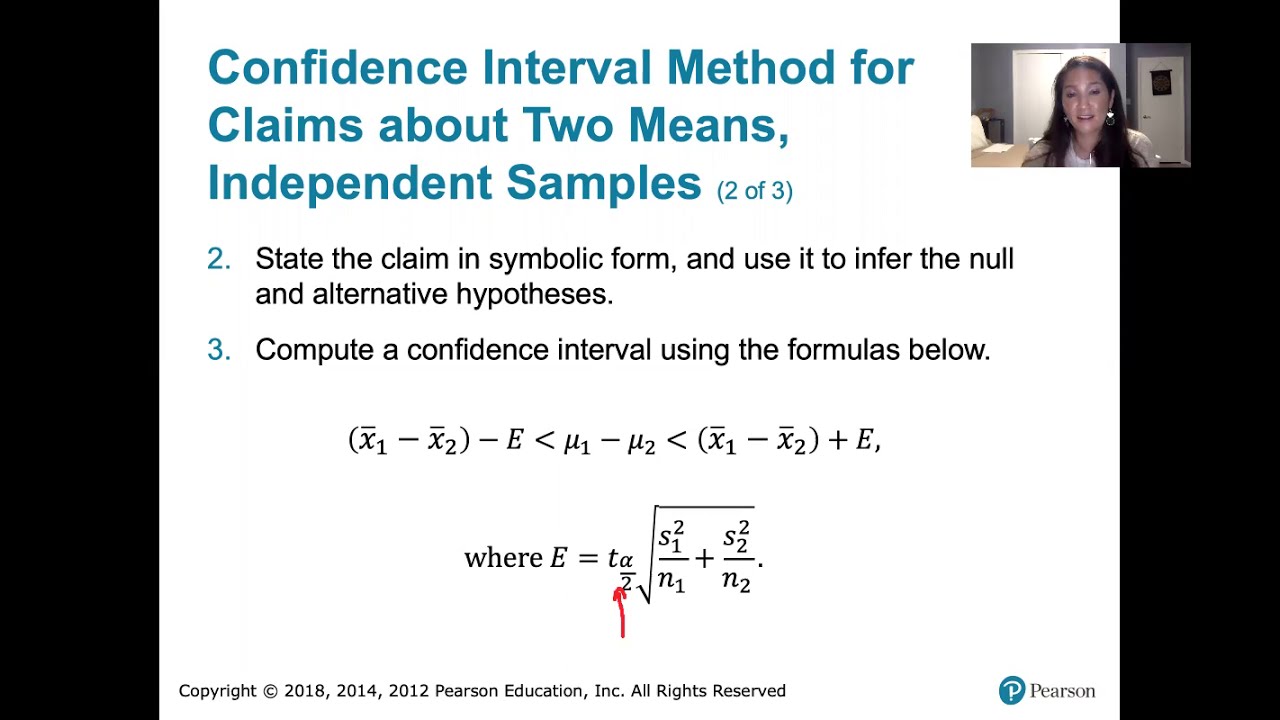
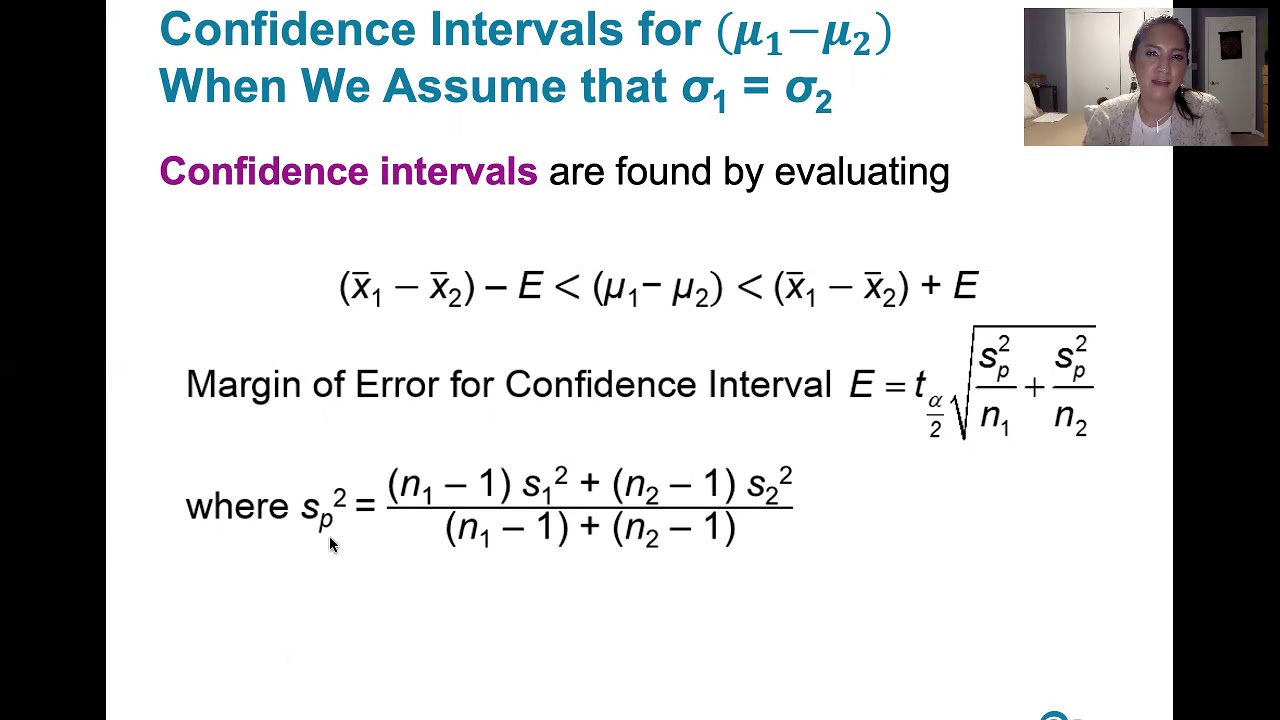
How is the confidence interval for the difference between two population means constructed?
-The confidence interval is constructed using the point estimate (x̄₁ - x̄₂), the critical value from the t-distribution, and the standard error estimate [√(s₁²/n₁ + s₂²/n₂)]. The margin of error is calculated as the critical value multiplied by the standard error estimate.
What is the conclusion of the example comparing the resting pulse rates of regular exercisers and non-exercisers?
-The conclusion is that the mean resting pulse rate for regular exercisers is less than that for non-regular exercisers, based on the significant difference indicated by the two-sample t-test.
Outlines
📚 Introduction to Inference on Two Independent Samples
This paragraph introduces Chapter 11 of a statistics lesson, focusing on inference for two treatments or populations using independent samples. The scenario involves expanding t-procedures to compare two means when samples cannot be paired. The lesson outlines the conditions for two-sample problems, including simple random sampling, independence of samples, and normality or large enough sample sizes. An example is presented where a researcher investigates whether state quarters weigh more than traditional quarters, with data collected from 18 state quarters and 16 traditional quarters.
🔍 Analyzing the Data and Setting Up Hypotheses
The script details the process of analyzing data from two independent samples, calculating sample means and standard deviations, and setting up hypotheses to test the claim that state quarters have a greater mean weight than traditional quarters at a 5% significance level. The null hypothesis (no difference in means) and the alternative hypothesis (state quarters have a greater mean weight) are defined. The test statistic formula, incorporating both samples' standard deviations and sizes, is explained, and a t-score of 2.37 is calculated.
📉 Determining the P-Value and Making a Statistical Decision
The paragraph explains how to determine the p-value for the calculated t-score to make a statistical decision. A conservative approach is taken by using the smaller of the two sample sizes to determine the degrees of freedom for the t-distribution. The p-value is found to be between 0.01 and 0.02, leading to the rejection of the null hypothesis in favor of the alternative. The use of a calculator for a more precise test is also mentioned, including the difference in degrees of freedom used by the calculator versus the conservative manual approach.
📝 Constructing a Confidence Interval for Two Independent Samples
The script outlines the steps to construct a 95% confidence interval for the difference between the population mean weights of state and traditional quarters. The formula for the confidence interval is provided, along with the method for calculating the margin of error using the critical value from the t-distribution and the standard error estimate. The process involves using the sample means, standard deviations, and sizes, as well as the conservative approach for determining the degrees of freedom.
👨🏫 Summary of Two-Sample Statistical Procedures
This paragraph summarizes the two-sample statistical procedures for both confidence intervals and hypothesis testing. It emphasizes the importance of understanding the conditions for using these procedures, such as the populations being normally distributed or having large enough sample sizes. The paragraph also highlights the formulas for the test statistic and the confidence interval, and the process of using a calculator to obtain more precise results due to its ability to calculate true degrees of freedom.
🏃♂️ Case Study: Comparing Resting Pulse Rates of Exercisers and Non-Exercisers
A case study is presented to compare the mean resting pulse rates of adult subjects who regularly exercise versus those who do not. The data is summarized in a table with sample sizes, means, and standard deviations for both groups. The paragraph explains how to construct a 95% confidence interval for the difference in means and perform a hypothesis test to determine if the mean resting pulse rate differs between the two groups, using both manual calculations and calculator outputs.
🌡️ Hypothesis Testing Using the Critical Value Method
This paragraph discusses the critical value method for hypothesis testing, using the example of comparing two wastewater treatment methods for benzene concentration. The script explains the process of verifying normality with normal probability plots due to small sample sizes, determining degrees of freedom, and calculating critical values for a two-tailed test at the 5% significance level. The test statistic is then compared to these critical values to decide whether to reject the null hypothesis.
🛠️ Conclusion on Two-Sample Problems and Statistical Inference
The final paragraph wraps up the lesson by emphasizing the utility of two-sample problems in comparing treatments or group characteristics. It mentions the importance of understanding both t-procedures for means and z-procedures for proportions in statistical inference. The script concludes by expressing hope that the audience is well-versed in these statistical procedures after the lesson.
Mindmap
Keywords
💡Inference
💡Confidence Intervals
💡Hypothesis Tests
💡Independent Samples
💡T-Procedures
💡Normal Distribution
💡Degrees of Freedom
💡P-Value
💡Test Statistic
💡Critical Value
💡Normal Probability Plot
Highlights
Introduction to Chapter 11 on conducting inference for confidence intervals and hypothesis tests for two treatments or populations.
Focus on inference about two means with independent samples where samples cannot be paired.
Expansion of t-procedures to include comparison of means from two independent samples.
Conditions for two sample problems: simple random sampling, independence, and approximately normal populations or large enough samples.
Example of comparing mean weight of state quarters to traditional quarters using independent samples.
Data entry and analysis of state and traditional quarters using lists and summary statistics.
Hypothesis testing of the claim that state quarters have a greater mean weight than traditional quarters at a 5% significance level.
Setup of test statistic and decision on the appropriate distribution model for hypothesis testing.
Calculation of the test statistic resulting in a t-score of 2.37 for the quarters example.
Determination of p-value and comparison to alpha for decision making in hypothesis testing.
Use of calculator programs for running two-sample t-tests and obtaining test statistic and p-value.
Difference between manual calculation using conservative degrees of freedom and calculator output.
Construction of a 95% confidence interval for the difference between population mean weights of state and traditional quarters.
Formula and steps for building a confidence interval for independent samples.
Example of comparing mean resting pulse rates of regular exercisers to non-exercisers.
Use of normal probability plots to assess normality of small sample populations.
Critical value method for hypothesis testing with small samples and assessment of treatment methods for wastewater benzene concentrations.
Construction of a 90% confidence interval for the difference in benzene concentration means between two wastewater treatments.
Summary of two-sample procedures for comparing treatments or group means in statistical inference.
Transcripts
Browse More Related Video

Elementary Stats Lesson # 21
9.2.4 Two Means, Indep. Samples - Confidence Intervals, St. Deviations Unknown, Not Assumed Equal

math 119 Chapter 9 part 2
9.2.5 Two Means, Indep. Samples - Three Additional Cases for Hypothesis Tests, Confidence Intervals

Elementary Stats Lesson #20
Math 119 Chapter 9 part 1
5.0 / 5 (0 votes)
Thanks for rating: