8.2.0 Testing a Claim About a Proportion - Lesson Overview, Learning Outcomes, Key Concepts
TLDRThis video script offers an in-depth lesson on hypothesis testing for a population proportion, focusing on the p-value and critical value methods. It's part of a three-section series from the 'Essentials of Statistics' by Mario Triola. The first part covers the normal approximation to the binomial distribution for hypothesis testing, while the second part introduces the exact method using binomial probability distributions, which is more accurate and typically requires technology for large sample sizes. The script also discusses the confidence interval method, recommending its use for estimation rather than hypothesis testing.
Takeaways
- 📚 The lesson is part of a series on hypothesis testing, specifically focusing on testing claims about a population proportion.
- 📈 Lesson 8.2 is divided into two main parts: the first part uses a normal approximation to the binomial distribution, while the second part uses the exact binomial distribution for more accurate results.
- 🔍 The script introduces the p-value method and the critical value method as tools for hypothesis testing, which are consistent with each other and provide the same answer every time.
- 📉 The normal approximation method is not used by professional statisticians for more accurate results; instead, they use the binomial distribution.
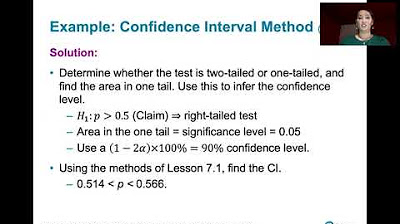
- 💡 The script mentions that the confidence interval method is not the focus, as it does not always lead to the same conclusion as the p-value and critical value methods.
- 🔢 The critical value and p-value methods are recommended for testing hypotheses, while the confidence interval method is suggested for estimating population proportions.
- 📝 The script is based on 'Essentials of Statistics, Sixth Edition' by Mario Triola and is modified to fit the course's needs.
- 🧑🏫 The instructor emphasizes the importance of understanding the requirements for the normal approximation methods and how to apply them to test claims about proportions.
- 🔬 The second part of the lesson will require the use of technology, such as Excel, to compute binomial probabilities and achieve results that match those of professional statisticians.
- 📝 Learning outcomes are outlined, with the first two associated with the normal approximation method and the third with using binomial probability distributions for exact testing.
- 🎥 The instructor plans to cover the normal approximation method in the next video, marking the beginning of part one of the lesson.
Q & A
What is the main topic of the video lesson?
-The main topic of the video lesson is testing a claim about a proportion, specifically focusing on hypothesis testing methods for population proportions.
What are the three sections covered in Chapter 8 of the textbook?
-The three sections covered in Chapter 8 are the basics of hypothesis testing, testing a claim about a proportion using the p-value method and critical value method, and the confidence interval method.
What are the two primary methods discussed for hypothesis testing in the video?
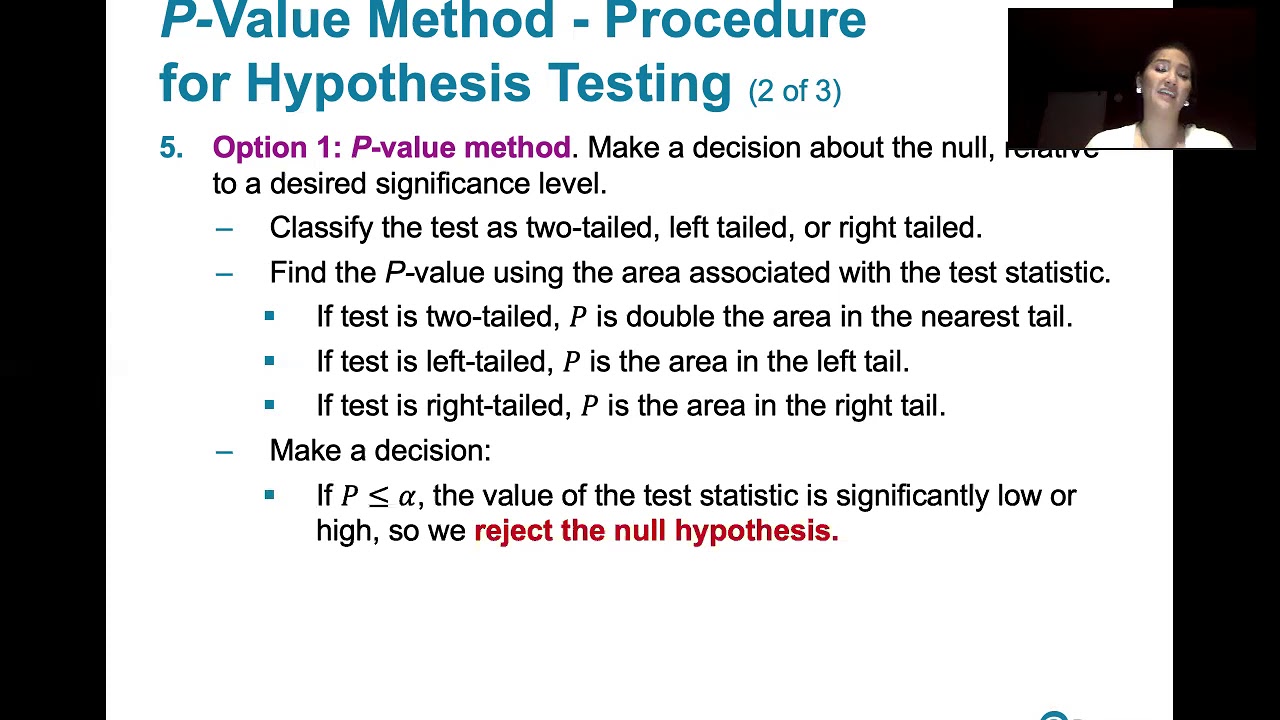
-The two primary methods discussed for hypothesis testing in the video are the p-value method and the critical value method.
Why are the p-value method and critical value method preferred over the confidence interval method for hypothesis testing?
-The p-value method and critical value method are preferred for hypothesis testing because they are consistent with each other and provide the same answer every time, unlike the confidence interval method which may not necessarily lead to the same conclusion.
What is the significance of using a normal approximation to the binomial distribution in the first part of lesson 8.2?
-The normal approximation to the binomial distribution serves as an introduction to basic concepts of hypothesis testing. It helps in understanding the process but is not the method used by professional statisticians for more accurate results.
What is the difference between using a normal approximation and using a binomial distribution for hypothesis testing?
-A normal approximation is a simpler method used for educational purposes, while the binomial distribution provides more accurate results and is the method used by professional statisticians, especially when sample sizes are large.
What tool is suggested for computing binomial probabilities in the video?
-Excel is suggested as the tool for computing binomial probabilities, allowing students to come up with the same answers as professional statisticians.
What are the learning outcomes associated with the first part of the lesson?
-The learning outcomes for the first part include understanding the requirements for the normal approximation methods and testing a claim about a proportion using confidence intervals.
What is the focus of the second part of the lesson?
-The focus of the second part of the lesson is to learn how to use binomial probability distributions to test a claim about a proportion, which is the exact method used for hypothesis testing.
Why is technology necessary for using the binomial distribution method?
-Technology is necessary for using the binomial distribution method because it helps in efficiently computing the probabilities, especially when the sample size is large, and leads to more accurate answers.
What is the textbook reference mentioned in the video?
-The textbook reference mentioned in the video is 'Essentials of Statistics Sixth Edition' by Mario Triola.
Outlines
📚 Introduction to Hypothesis Testing for Proportions
This paragraph introduces Lesson 8.2, which focuses on hypothesis testing for a claim about a proportion. The content is based on Pearson's slides and modified for the course. It is the second of three sections in Chapter 8, following the basics of hypothesis testing covered in 8.1. The lesson will delve deeper into testing claims about proportions using both the p-value method and the critical value method. These methods are applicable to population proportions, probabilities, or their decimal equivalents. The paragraph also mentions a brief discussion on the confidence interval method, but it is not the focus due to the consistency and congruence of the p-value and critical value methods in hypothesis testing.
Mindmap
Keywords
💡Hypothesis Testing
💡Population Proportion (p)
💡P-Value Method
💡Critical Value Method
💡Normal Approximation
💡Binomial Distribution
💡Sample Proportion (p-hat)
💡Confidence Interval Method
💡Essentials of Statistics
💡Technology
💡Learning Outcomes
Highlights
Lesson 8.2 focuses on testing claims about a population proportion using hypothesis testing.
The lesson is based on slides modified from Pearson's materials to accompany 'Essentials of Statistics' by Mario Triola.
Hypothesis testing was introduced in Chapter 8.1, covering the critical value and p-value methods.
The p-value and critical value methods are consistent and will provide the same answer when testing a claim about a proportion.
The lesson is divided into two parts: using a normal approximation to the binomial distribution and using the exact binomial distribution.
Normal approximation is an introduction to basic concepts but is not the method used by professional statisticians.
For more accurate results, professional statisticians use the binomial distribution, which requires technology for large sample sizes.
Excel can be used to compute binomial probabilities and achieve results consistent with professional statistical methods.
Learning outcomes include understanding the requirements for normal approximation methods and testing claims about proportions.
Confidence intervals will be discussed for estimating population proportions but not for hypothesis testing.
The critical value and p-value methods are recommended for testing hypotheses, while confidence intervals are for estimation.
Binomial probability distributions will be used in the exact method for testing claims about proportions, which is the professional approach.
The exact method was briefly introduced in Chapter 5 without being labeled as hypothesis testing.
The video will cover the normal approximation method for testing claims about proportions in the next part.
Technology is necessary for efficient and accurate computation of binomial probabilities in hypothesis testing.
The lesson aims to bridge the understanding of hypothesis testing from basic concepts to professional statistical practices.
Transcripts
Browse More Related Video
8.2.2 Testing a Claim About A Proportion - Confidence Interval Method, Comparison to Other Methods
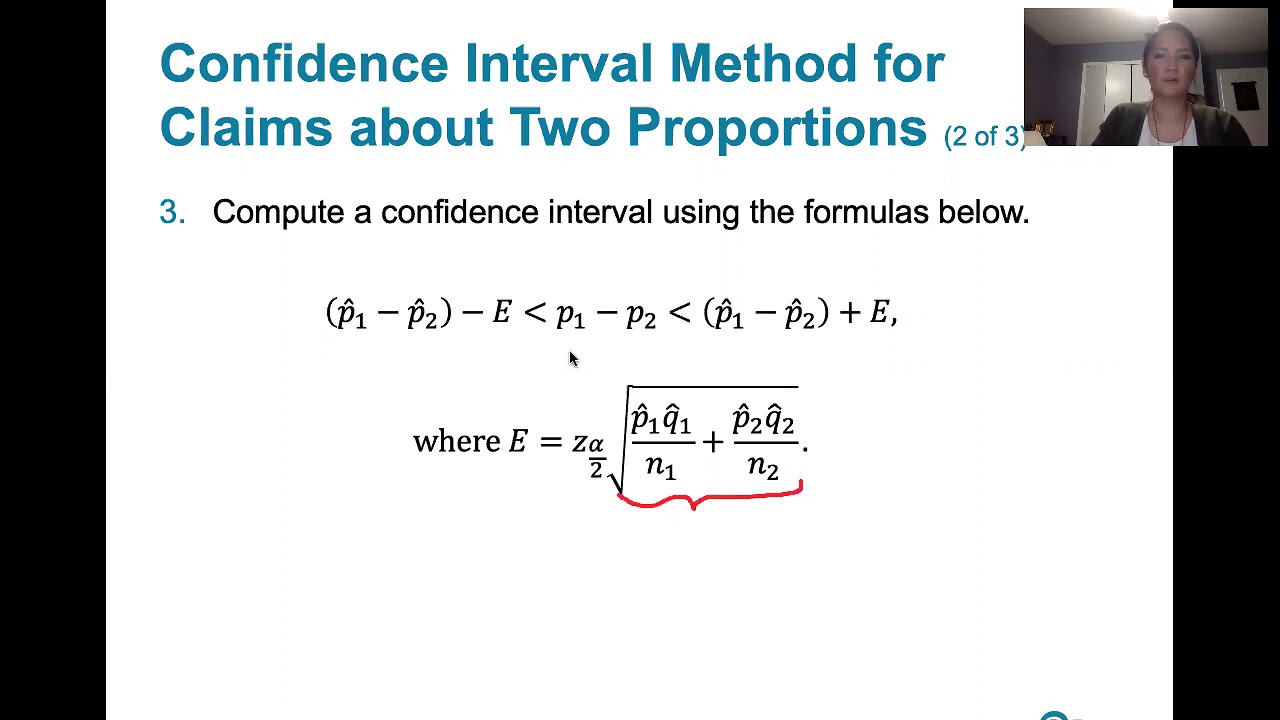
9.1.4 Two Proportions - Confidence Intervals for the Difference Between Two Proportions
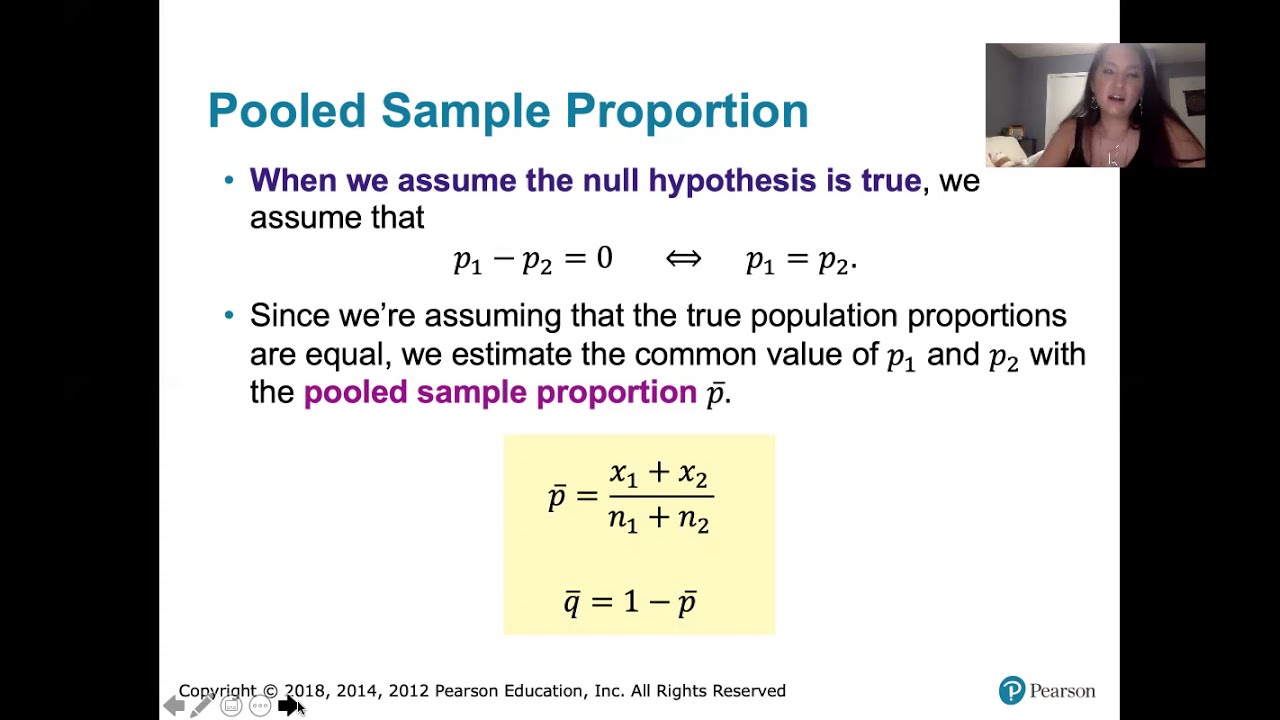
9.1.1 Two Proportions - Rationale Behind Hypothesis Tests Involving Two Proportions
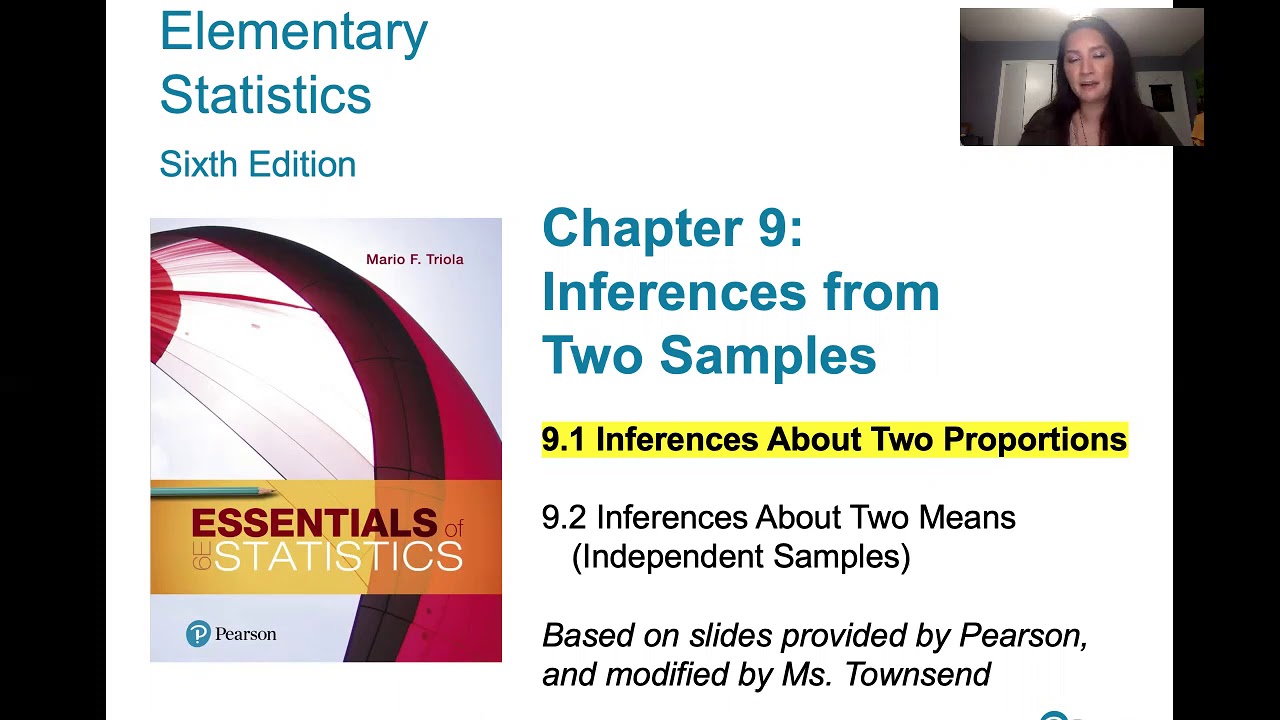
9.1.0 Two Proportions - Lesson Overview, Key Concepts, Learning Outcomes
9.2.2 Two Means, Independent Samples - The Rationale Behind The Equivalent Methods, P-value Method
8.2.1 Testing a Claim About a Proportion - P-value, Critical Value Methods, Normal Approximation
5.0 / 5 (0 votes)
Thanks for rating: