8.1.5 Basics of Hypothesis Testing - P-value Method, and Comparison to the Critical Value Method
TLDRThis video tutorial delves into the p-value method for hypothesis testing, contrasting it with the critical value method. It clarifies that both methods aim to reach the same conclusion through different approaches: comparing test statistics to critical values or p-values to significance levels. The script guides viewers through the process of hypothesis testing, from formulating hypotheses to calculating p-values and making decisions based on them. It also discusses the importance of distinguishing between p-values and population/sample proportions, and provides a mnemonic to remember decision criteria. An example using consumer comfort with drone deliveries is used to illustrate the process, emphasizing the interpretation of results in the context of the original claim.
Takeaways
- 📊 The script discusses the p-value method for testing hypotheses, emphasizing its comparison with the critical value method as two approaches to reach the same conclusion.
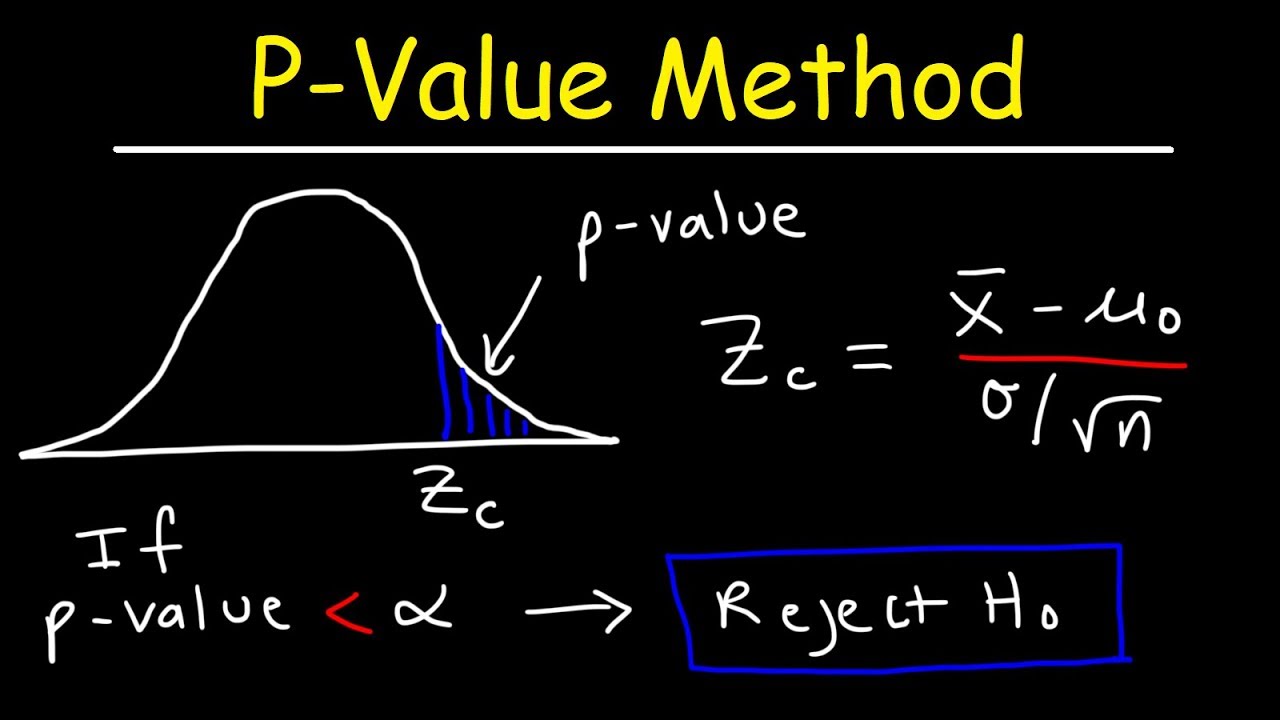
- 🔍 The p-value is defined as the probability of obtaining a test statistic at least as extreme as the one from the sample data, assuming the null hypothesis is true.
- 📉 The critical value method involves comparing the test statistic to predefined critical values associated with the significance level, whereas the p-value method compares the tail probabilities.
- 📝 The process of hypothesis testing includes stating the null and alternative hypotheses, identifying the sample statistic, calculating the test statistic, and making a decision about the null hypothesis based on the p-value.
- 🧩 The difference between the population parameter (P), the sample proportion (p-hat), and the p-value (P-value) is highlighted, with distinct notation to avoid confusion.
- 📚 The script explains the steps for hypothesis testing, including graphing the sampling distribution, identifying the sample statistic, and determining if it is an extreme value.
- 🔢 The significance of converting the sample statistic to a test statistic, such as a z-score, t-score, or chi-squared score, is discussed to standardize the sampling distribution for comparison.
- ✅ The decision rule for the p-value method is that if the p-value is less than or equal to the significance level (alpha), the null hypothesis is rejected; otherwise, it is not rejected.
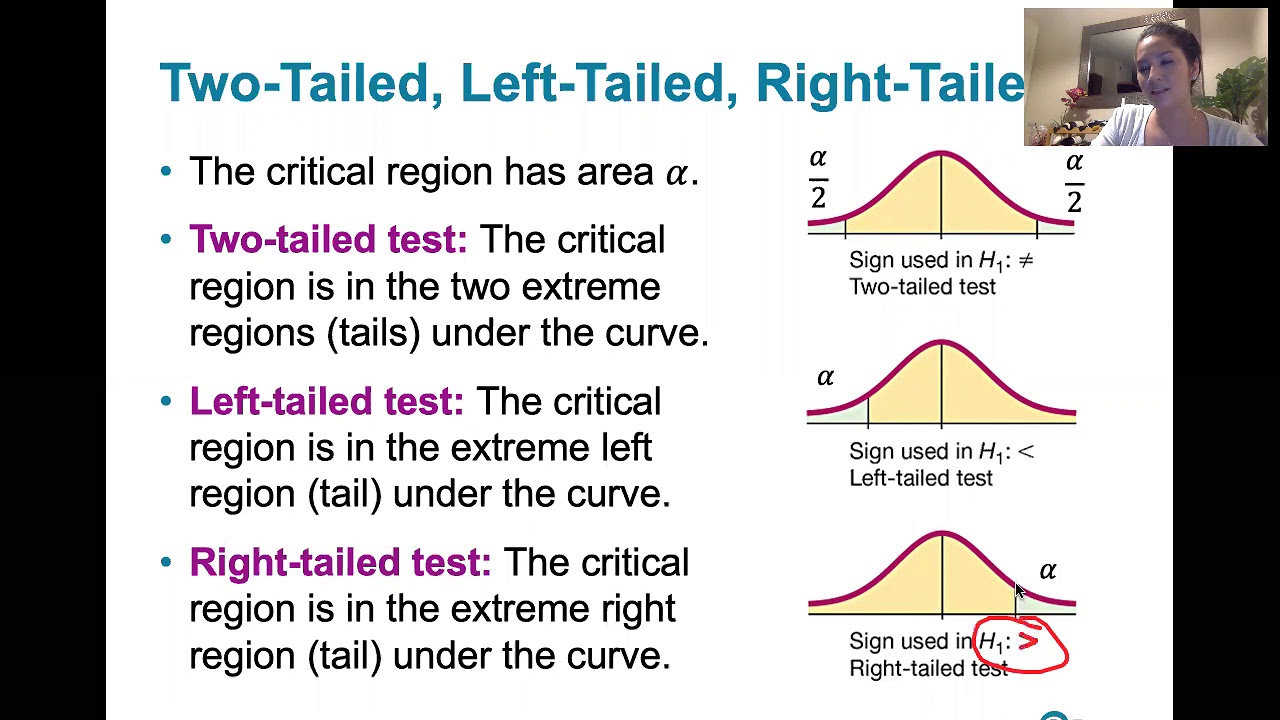
- 📉 The concept of a two-tailed test is explained, where the p-value is doubled to account for the area in both tails, which is key for tests not concerned with the direction of the extreme value.
- 🗣️ The importance of concluding a hypothesis test in layman's terms is stressed to communicate the findings effectively to a non-technical audience.
- 📚 An example is provided to illustrate the process of using the p-value method, including calculating the z-score and finding the associated p-value to make a decision about the null hypothesis.
Q & A
What are the two primary methods for testing hypotheses discussed in the script?
-The two primary methods for testing hypotheses discussed in the script are the critical value method and the p-value method.
What is a p-value in the context of a hypothesis test?
-A p-value is the probability or area associated with getting a test statistic that is at least as extreme as the test statistic obtained from the sample data, assuming that the null hypothesis is true.
How is the critical value method different from the p-value method?
-The critical value method involves comparing the test statistic to the critical values associated with a particular significance level, whereas the p-value method involves comparing the probabilities or areas in the tails of the distribution associated with the test statistic.
What is the significance of the null hypothesis in hypothesis testing?
-The null hypothesis is a statement of no effect or no difference that is tested against an alternative hypothesis. It is assumed to be true at the start of the hypothesis test, and the test is conducted to see if the sample data provide enough evidence to reject this assumption.
What is the difference between a population proportion (p) and a sample proportion (p-hat)?
-A population proportion (p) is the true proportion of a characteristic in the entire population, while a sample proportion (p-hat) is the proportion observed in a sample drawn from that population.
How do you determine if a sample statistic is an extreme value in the context of hypothesis testing?
-A sample statistic is considered an extreme value if it is very unlikely to occur by chance given that the null hypothesis is true. This is typically determined by comparing the test statistic to the critical value or the p-value to the significance level (alpha).
What is the significance of the significance level (alpha) in hypothesis testing?
-The significance level (alpha) is the probability of rejecting the null hypothesis when it is actually true. It is used to determine the threshold for deciding whether the results of a hypothesis test are statistically significant.
What is the purpose of converting a sample statistic to a test statistic like a z-score, t-score, or chi-squared score?
-Converting a sample statistic to a test statistic like a z-score, t-score, or chi-squared score standardizes the sample data and allows for the comparison of the sample statistic to a known distribution, which facilitates the calculation of p-values and the determination of statistical significance.
How do you decide whether to reject or fail to reject the null hypothesis using the p-value method?
-You decide to reject the null hypothesis if the p-value is less than or equal to the significance level (alpha), indicating that the observed sample statistic is significantly different from what would be expected if the null hypothesis were true. If the p-value is greater than alpha, you fail to reject the null hypothesis, meaning there is not enough evidence to suggest the null hypothesis is false.
Can you provide an example of how to calculate a z-score from a sample proportion?
-Yes, a z-score can be calculated from a sample proportion (p-hat) using the formula: (p-hat - p) / sqrt((p * (1 - p)) / n), where p is the hypothesized population proportion from the null hypothesis, and n is the sample size.
What is the role of the alternative hypothesis in hypothesis testing?
-The alternative hypothesis is a statement that contradicts the null hypothesis and represents the research hypothesis that the researcher is testing. It is used to define the direction of the test (one-tailed or two-tailed) and to interpret the results of the hypothesis test.
Outlines
📊 Hypothesis Testing: P-value Method Overview
This paragraph introduces the p-value method for testing hypotheses, which is an alternative to the critical value method. The p-value is defined as the probability of obtaining a test statistic at least as extreme as the one from the sample data, assuming the null hypothesis is true. The speaker emphasizes the importance of distinguishing between the p-value and population/sample proportions, denoted by different cases of 'p'. The process of hypothesis testing using the p-value method involves stating the hypotheses, identifying the sample statistic, computing the test statistic (like z-score), and comparing it to the p-value to make a decision about the null hypothesis. The critical value and p-value methods are highlighted as two approaches leading to the same conclusion.
📉 Decision Making with P-values in Hypothesis Testing
The paragraph explains the decision-making process using p-values in hypothesis testing. It details how to find the p-value for left-tailed, right-tailed, and two-tailed tests, and how to compare it with the significance level (alpha). If the p-value is less than or equal to alpha, the null hypothesis is rejected, indicating the test statistic is significantly high or low. If the p-value is greater than alpha, the null hypothesis is not rejected due to insufficient evidence. The speaker also provides a mnemonic to remember the decision criterion and discusses the importance of concluding in layman's terms for better understanding.
🛍️ Consumer Comfort with Drone Deliveries: A Hypothesis Test Example
This paragraph presents a real-world example of hypothesis testing using the p-value method. It involves a survey of consumers about their comfort level with drone deliveries. The claim is tested that the majority of consumers are not comfortable with drones, with a significance level of 0.05. The process includes stating the null and alternative hypotheses, calculating the sample proportion, and sketching the sampling distribution. The speaker demonstrates how to compute the z-score from the sample proportion and how to find the corresponding p-value to make a decision about the null hypothesis.
📉 Calculating the Z-Score and P-value for Drone Delivery Example
The speaker continues the example of consumer comfort with drone deliveries, focusing on calculating the z-score for the sample proportion. The formula for the z-score is explained, and the speaker shows how to compute it using the sample proportion, the assumed population proportion from the null hypothesis, and the sample size. The resulting z-score is then used to find the p-value, which represents the probability of obtaining such an extreme sample proportion if the null hypothesis is true.
📊 Interpreting the P-value and Making a Hypothesis Test Decision
The paragraph explains how to interpret the p-value in the context of the drone delivery example. The p-value is compared with the significance level (alpha) to decide whether to reject the null hypothesis. In this case, the p-value is calculated using a standard normal distribution table or Excel, and it is found to be less than alpha, leading to the rejection of the null hypothesis. This suggests that a majority of consumers are indeed not comfortable with drone deliveries, supporting the original claim.
📝 Finalizing the Hypothesis Test Conclusion
The speaker discusses the importance of wording the final conclusion of a hypothesis test in a way that is understandable to everyone, not just statisticians. The paragraph outlines the process of determining the appropriate wording based on the original claim and the result of the hypothesis test. A flowchart is mentioned as a tool to guide students in choosing the correct conclusion based on whether the original claim contains the condition of equality and whether the null hypothesis was rejected or not.
🔍 Comparing Critical Value and P-value Methods
This paragraph delves into the comparison between the critical value method and the p-value method for hypothesis testing. Both methods are shown to be equivalent, with the critical value method comparing the test statistic to a critical value, while the p-value method compares the area in the tail (p-value) to the significance level (alpha). The speaker illustrates that if the test statistic is in the critical region, the corresponding p-value will be less than alpha, leading to the rejection of the null hypothesis in both methods.
🔚 Wrapping Up the Discussion on P-value Method
In the final paragraph, the speaker wraps up the discussion on the p-value method, noting that it is often used more frequently in research due to its association with probabilities. The speaker emphasizes that both the critical value and p-value methods will yield the same result, and the choice between them is a matter of preference. The paragraph ends with a teaser for the next video, which will discuss the power of a hypothesis test and introduce the concept of type two error.
Mindmap
Keywords
💡p-value method
💡critical value method
💡hypothesis testing
💡null hypothesis
💡alternative hypothesis
💡significance level (alpha)
💡test statistic
💡sampling distribution
💡z-score
💡rejection of the null hypothesis
Highlights
Introduction to learning outcome number five from lesson 8.1, focusing on the p-value method for testing hypotheses.
Comparison of the critical value method and the p-value method as two different approaches to reach the same conclusion in hypothesis testing.
Explanation of the critical value method, which involves comparing the test statistic to critical values at a given significance level.
Description of the p-value method, contrasting it with the critical value method by emphasizing the comparison of probabilities or tail areas.
Definition of p-value in a hypothesis test as the probability of obtaining a test statistic at least as extreme as the sample data, assuming the null hypothesis is true.
Clarification of the difference between the p-value and population parameters, with a focus on notation and understanding the context of their use.
Process of hypothesis testing using the p-value method, starting from writing claims symbolically to identifying null and alternative hypotheses.
Importance of identifying the sample statistic and sample size, and graphing the sampling distribution assuming the null hypothesis is true.
Method of converting the sample statistic to a test statistic, such as a z-score, t-score, or chi-squared score, based on the parameter of interest.
Decision-making process in hypothesis testing, classifying the test as two-tailed, left-tailed, or right-tailed, and finding the p-value.
Explanation of how to find the p-value for different types of tests, including how to handle two-tailed tests by doubling the area in the nearest tail.
Decision criteria for the p-value method, comparing the p-value to the significance level alpha to determine if the null hypothesis should be rejected.
Mnemonic for remembering the decision criterion in hypothesis testing: 'If p is low, the null must go; if p is high, the null can fly.'
Application of the p-value method through an example involving consumer comfort with drone deliveries, testing the claim that the majority are not comfortable.
Detailed walkthrough of calculating the z-score from a sample proportion, emphasizing the importance of accurate calculator entry.
Determination of the p-value associated with a z-score, using both table lookup and Excel functions to find the area in the tail.
Comparison of the calculated p-value to the significance level to make a decision on the null hypothesis, with an example demonstrating rejection of the null hypothesis.
Guidance on wording the final conclusion of a hypothesis test in layman's terms, making the results accessible to those unfamiliar with statistical jargon.
Discussion on the similarity and difference between the critical value method and the p-value method, emphasizing their equivalence in hypothesis testing.
Visual representation and comparison of the critical value method and the p-value method, illustrating their underlying mathematical equivalence.
Transcripts
Browse More Related Video

Elementary Stats Lesson #18
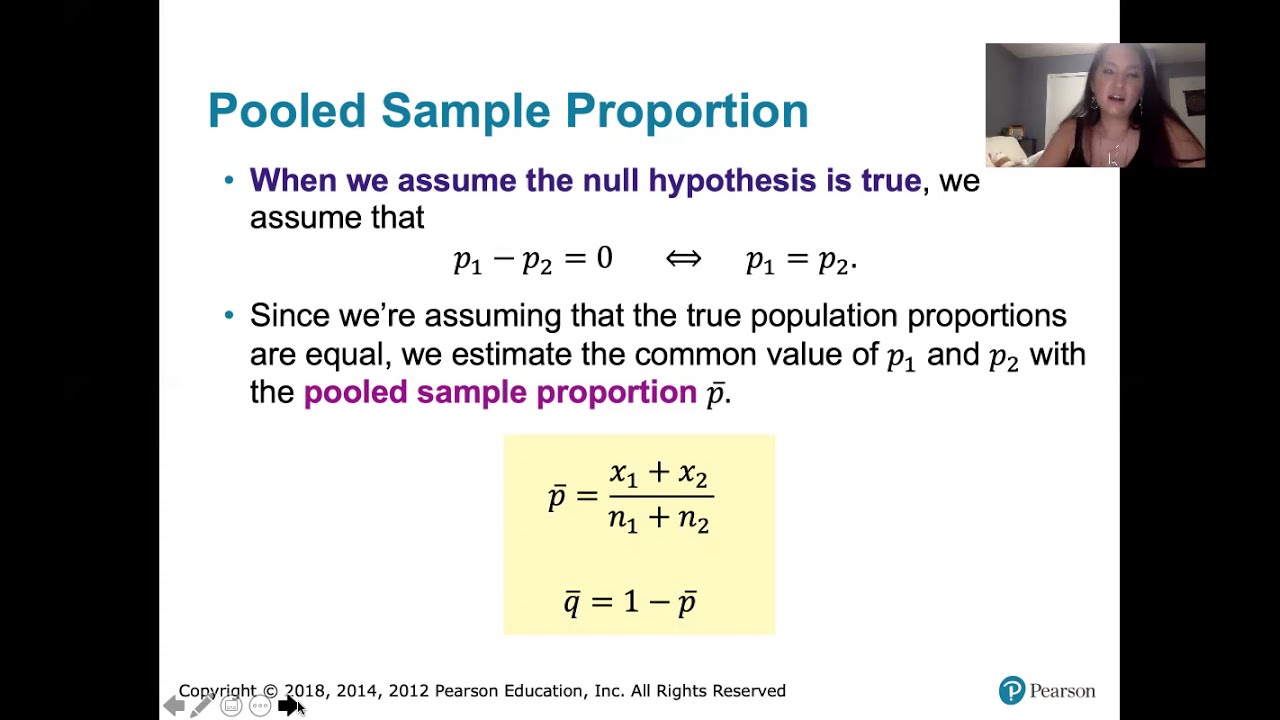
9.1.1 Two Proportions - Rationale Behind Hypothesis Tests Involving Two Proportions
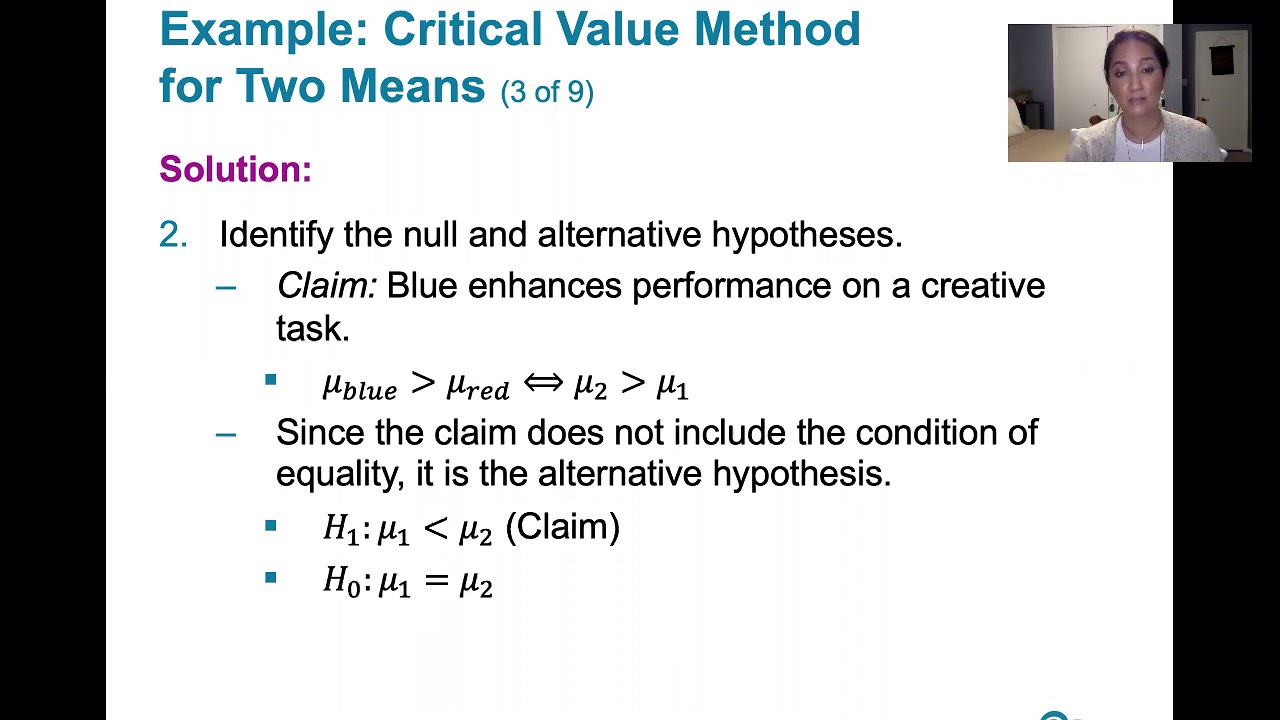
9.2.3 Two Means, Indep. Samples - Critical Value Method, St. Deviations Unknown, Not Assumed Equal
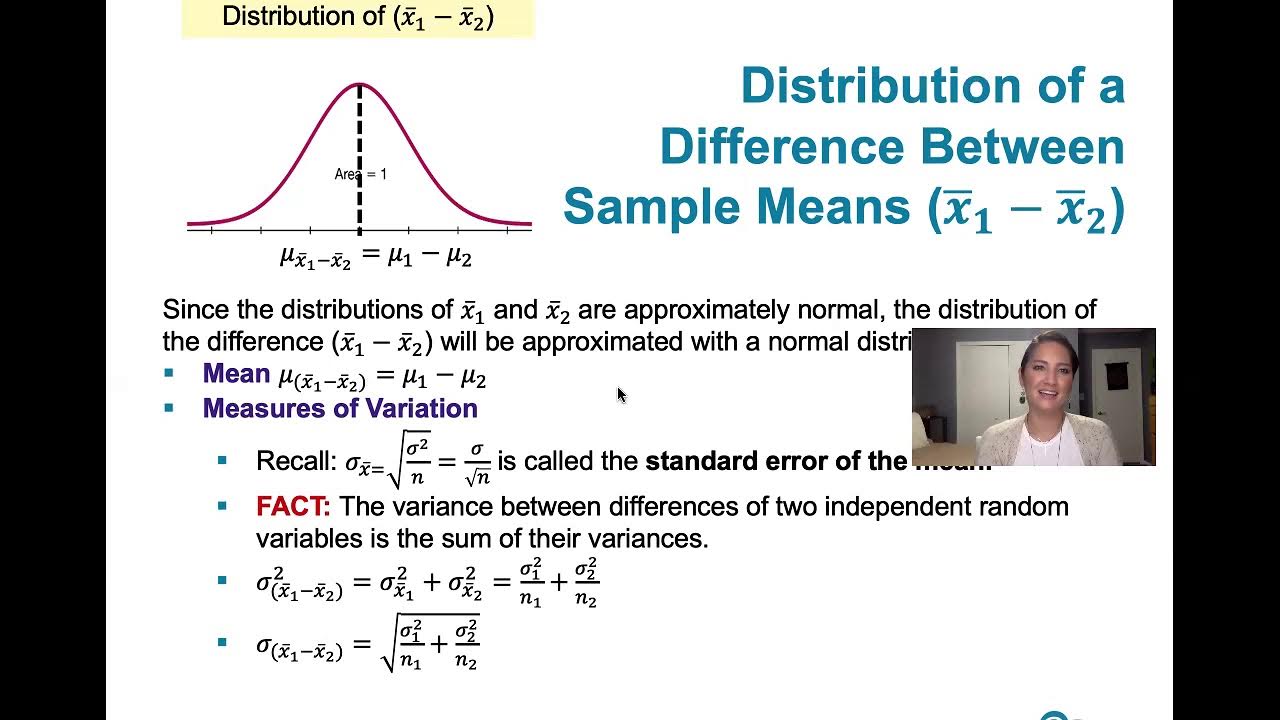
9.2.2 Two Means, Independent Samples - The Rationale Behind The Equivalent Methods, P-value Method
P-Value Method For Hypothesis Testing
8.1.4 Basics of Hypothesis Testing - The Critical Value Method for a Population Proportion
5.0 / 5 (0 votes)
Thanks for rating: