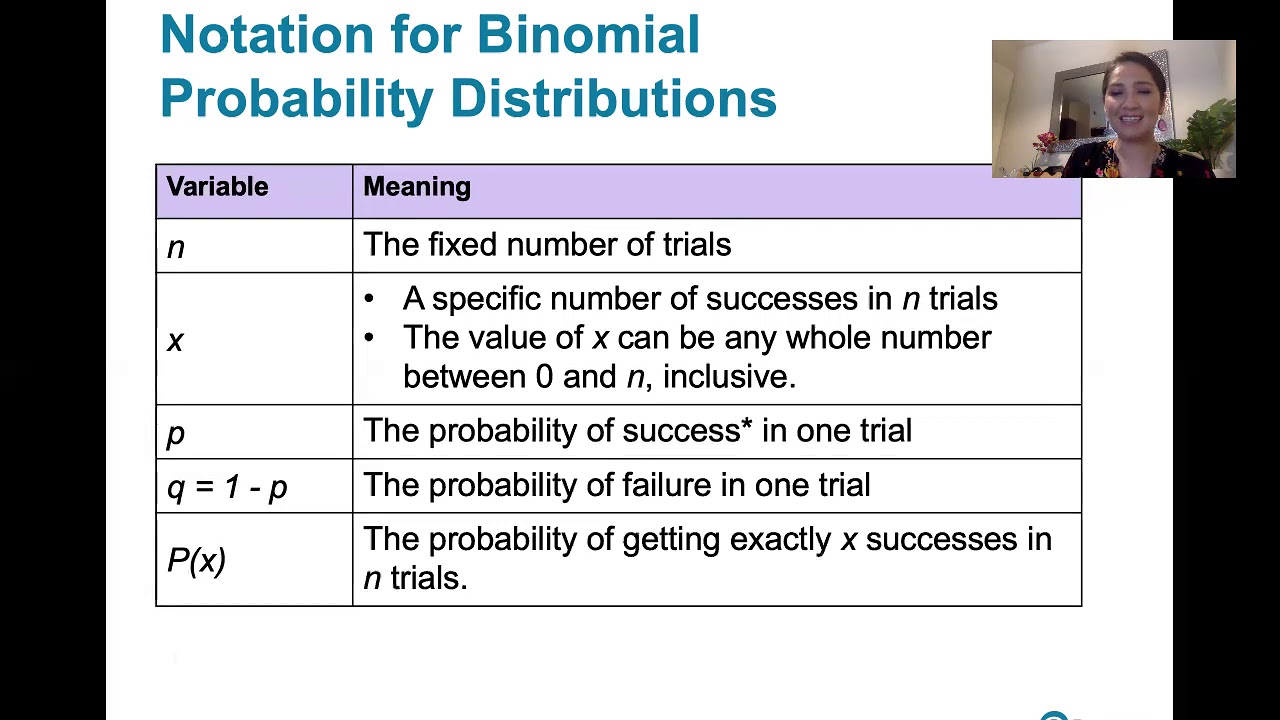
5.2.5 Binomial Probability Distributions - Using Probabilities to Determine Significance
TLDRThis video script delves into the application of binomial probability distributions to determine if a number of successes is significantly high or low. It revisits the concept introduced in lesson 5.1, now with a deeper understanding of binomial distributions. The script explains how to calculate probabilities of getting a certain number of correct guesses on a standardized test, using either technology or binomial tables, and interprets these probabilities to assess the significance of three correct guesses out of four, concluding that it is a rare event with a probability of just 2.8%.
Takeaways
- 📚 The video discusses learning outcome number five from a statistics lesson, focusing on using probabilities to determine if a number of successes is significantly high or low.
- 📈 The concept of binomial probability distributions is introduced as a tool to answer questions about the significance of a number of successes.
- 🔢 A success is considered significantly high if the probability of getting that many or more successes is ≤ 0.05 (5%), and significantly low if the probability of getting that many or fewer successes is ≤ 0.05.
- 🎯 The 0.05 threshold is a common standard for significance, but other thresholds like 0.01 (1%) or 0.10 (10%) can also be used depending on the context.
- 📉 The significance of a number of successes is determined by looking at the probabilities in the 'tails' of the distribution, which represent rare events.
- 🧩 The video uses a standardized test scenario where guessing on multiple-choice questions is used to illustrate the application of binomial probabilities.
- 📝 The video recommends using technology or binomial probability tables to calculate the probabilities for different numbers of successes in a given number of trials.
- 📊 Excel is used to demonstrate how to calculate binomial probabilities, emphasizing the ease of use and accuracy of technology for such calculations.
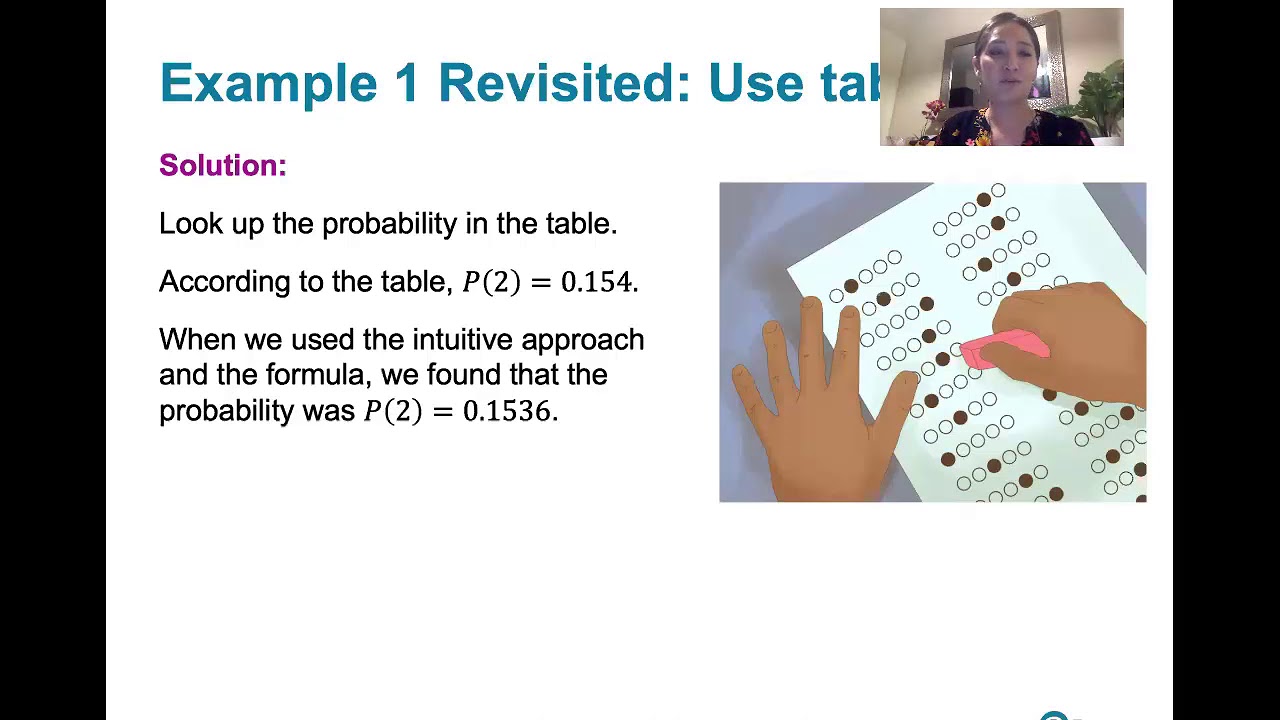
- 🔍 The video compares the results obtained from Excel calculations with those from a binomial probability table to validate the findings.
- 🤔 The video concludes by determining the significance of guessing three out of four questions correctly on a standardized test, using the calculated probabilities.
- 📉 It is revealed that a probability of 2.8% for guessing three or four questions correctly is significantly high when compared to the 5% threshold.
Q & A
What is the main topic of the video?
-The main topic of the video is using probabilities to determine if a number of successes is significantly high or significantly low, specifically in the context of binomial probability distributions.
What was the significance of the 0.05 value discussed in the video?
-The 0.05 value is a common cutoff used to determine if a number of successes is significantly high or low. If the probability of getting x successes or more (or fewer) is less than or equal to 0.05, it is considered rare and thus significantly high or low.
What is the alternative to the 0.05 cutoff mentioned in the video?
-An alternative to the 0.05 cutoff is 0.01, which corresponds to a probability of less than or equal to 1%, indicating an even rarer event.
How can the probabilities be translated into a more understandable format?
-Probabilities can be translated into percentages to make them more understandable. For example, a probability of 0.05 can be translated to 5%.
What is the context in which the video discusses the application of binomial probability distributions?
-The video discusses the application of binomial probability distributions in the context of standardized tests, such as the SAT or ACT, where multiple-choice questions have five possible answers and the probability of guessing correctly is 1 in 5.
What is the recommended approach to calculate the probabilities for the binomial distribution in this scenario?
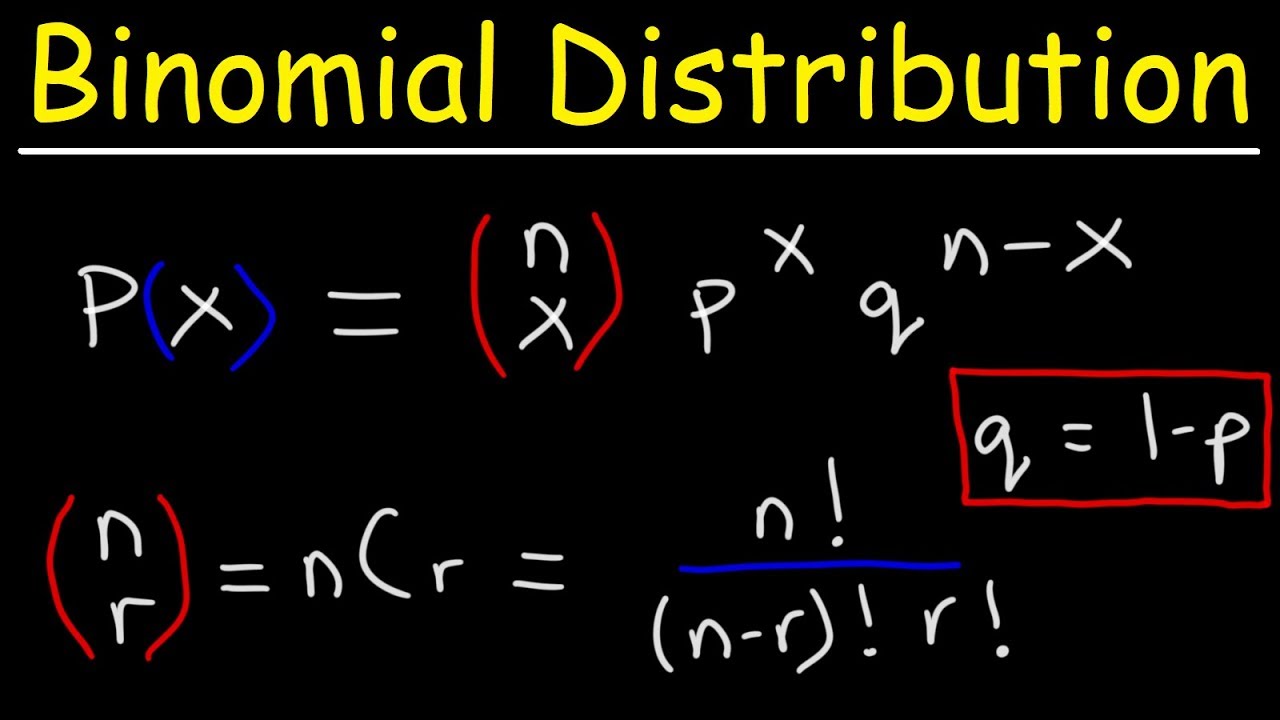
-The recommended approach is to use technology or look up the probabilities in a binomial table, rather than using the formulaic or intuitive approach, due to the need to find five different probabilities.
What does the video suggest as a method to find the probability of getting a certain number of correct guesses in a standardized test?
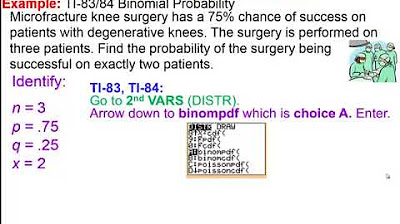
-The video suggests using the binomial function in Excel or looking up the probabilities in a binomial table provided during the exam.
How does the video demonstrate the calculation of probabilities for different numbers of correct guesses?
-The video demonstrates the calculation by using Excel's binomial function and comparing the results with a binomial table to ensure accuracy.
What is the significance of the 2.8% probability calculated in the video?
-The 2.8% probability represents the likelihood of guessing three or four questions correctly out of four in a standardized test, which is considered significantly high because it is less than the 5% cutoff.
How does the video interpret the 2.8% probability in terms of significance?
-The video interprets the 2.8% probability as rare, indicating that it is even rarer than the 5 percentile cutoff, and thus it is considered a significantly high number of correct guesses by chance.
Outlines
📊 Understanding Significance in Binomial Distributions
This paragraph introduces the concept of determining the significance of a number of successes in a binomial distribution. It revisits the topic from lesson 5.1 but now with the knowledge of binomial probability distributions. The significance is measured by comparing the probability of achieving a certain number of successes (x) or more, to a threshold of 0.05 or 5%, which is considered rare. The paragraph also mentions alternative thresholds like 0.01 for even rarer events and 0.10 for less extreme cases. It explains the process of evaluating whether a number of correct guesses in a standardized test is significantly high by using the binomial distribution formula and emphasizes the importance of using technology or tables for calculating probabilities due to the complexity of having multiple outcomes.
🔢 Calculating Binomial Probabilities with Technology and Tables
The second paragraph demonstrates how to calculate binomial probabilities for a scenario where a student guesses on four multiple-choice questions with five options each. It suggests using technology, such as Excel, to calculate the probabilities for zero to four correct guesses, which are then compared to the probabilities found in a binomial table provided for exams. The technology is shown to give results that match the table, confirming the accuracy of both methods. The paragraph illustrates the use of the BINOM.DIST function in Excel and emphasizes the importance of matching the correct parameters, such as the number of trials (n), number of successes (x), and the probability of success (p), to ensure accurate calculations.
🎯 Assessing Significance of Correct Guesses in a Standardized Test
The final paragraph focuses on applying the calculated probabilities to determine if getting three or four correct guesses out of four in a standardized test is significantly high. It explains the process of adding the probabilities of these two outcomes to find the total probability of such an event occurring. The result, 0.028 or 2.8%, is then compared against the class's significance threshold of 0.05 or 5%. Since the calculated probability is lower, it is concluded that getting three or four correct guesses is indeed a significantly high outcome, indicating an unlikely event that suggests more than just chance may be at play.
Mindmap
Keywords
💡Binomial Probability Distributions
💡Significantly High
💡Significantly Low
💡Probability
💡Successes
💡Trials
💡Standardized Tests
💡Multiple Choice Questions
💡Excel
💡Binomial Table
💡Cumulative Probability
Highlights
The video discusses learning outcome number five from lesson 5.2, focusing on using probabilities to determine if a number of successes is significantly high or low.
The concept of binomial probability distributions is introduced to answer questions regarding the significance of success numbers, building upon lesson 5.1.
A significantly high number of successes is defined as having a probability of success of less than or equal to 0.05, or 5%.
The probability of x successes or fewer is considered significantly low if it is less than or equal to 0.05, or 5%.
Alternative significance markers such as 0.01 for 1% and 0.10 for 10% are mentioned, though 0.05 is commonly used.
The significance of values is determined by their position on a number line, with significantly high or low values being on the extremes.
The video revisits a question from a previous lesson, this time using probabilities to determine if three correct guesses out of four is significantly high.
A binomial probability distribution is created for x successes in four trials, with success defined as a correct guess.
Technology or binomial probability tables are recommended for calculating the five different probabilities for the problem.
Excel is used to demonstrate the calculation of binomial probabilities, with the BINOM.DIST function.
The probabilities for zero to four correct guesses are calculated using Excel, resulting in 0.4096 for each.
Binomial probability table values are confirmed to match the Excel calculations, ensuring accuracy.
The addition rule is applied to combine the probabilities of three or four correct guesses to determine significance.
The combined probability of three or four correct guesses is found to be 0.028, which is significantly high compared to the 0.05 threshold.
The 2.8% probability of three or four correct guesses is rarer than the 5 percentile cutoff, emphasizing its significance.
The video concludes by emphasizing the use of percentages to interpret the significance of probabilities for better understanding.
Transcripts
Browse More Related Video

5.2.4 Binomial Distributions - Mean, St. Dev., Using Range Rule of Thumb to Find Significant Values
5.2.1 Binomial Probability Distributions - Is this procedure described by a binomial distribution?
Finding The Probability of a Binomial Distribution Plus Mean & Standard Deviation
Elementary Statistics - Chapter 5 Binomial Distributions Part 2
5.2.3.2 Binomial Distributions - Find binomial probabilities using a table.

Math 119 Chapter 5 part 2
5.0 / 5 (0 votes)
Thanks for rating: