5.2.4 Binomial Distributions - Mean, St. Dev., Using Range Rule of Thumb to Find Significant Values
TLDRThis video lesson explores the computation of mean, variance, and standard deviation for a binomial probability distribution. It teaches how to apply these statistical measures with the range rule of thumb to identify significantly high or low values. The script uses a practical example of guessing multiple-choice questions to demonstrate the calculation of these statistics and their significance, concluding with the determination of whether three correct guesses out of four is an unusually high outcome.
Takeaways
- 📚 The video discusses learning outcome number four from lesson 5.2, focusing on the binomial probability distribution.
- 🧮 The expected value or mean of a binomial distribution is calculated as the number of trials (n) multiplied by the probability of success (p).
- 🎯 An example given is guessing true/false questions where the mean number of correct answers is the number of questions multiplied by the probability of guessing correctly (e.g., 30 questions with a 50% chance of being correct equals 15 expected correct answers).
- 📈 Variance in a binomial distribution is calculated by multiplying the number of trials by the product of the probability of success and failure (npq), and the standard deviation is the square root of the variance.
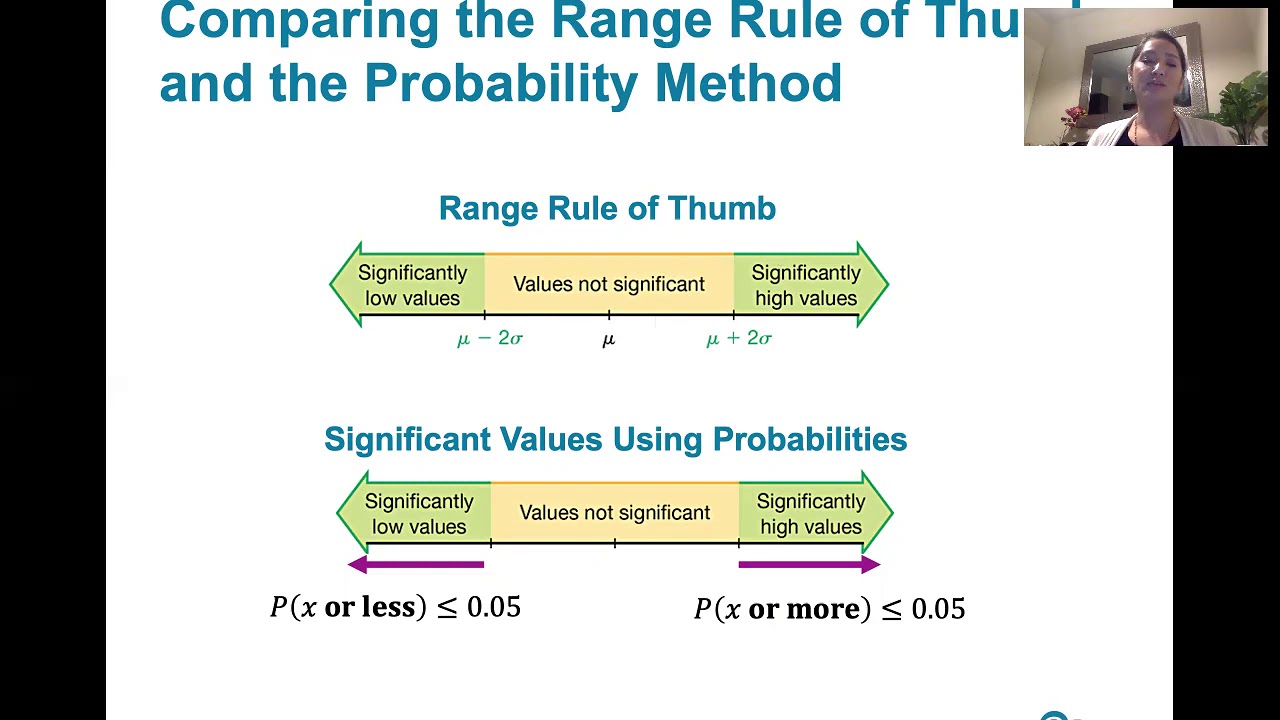
- 📉 The range rule of thumb states that values within two standard deviations of the mean are typical, while those beyond are considered significantly high or low.
- 📊 The significance of a value can be visually determined by its position in the distribution, with values in the far tails being significantly high or low.
- 🔢 The video applies the concepts to a standardized testing scenario, where guessing multiple-choice questions with five options results in a mean of 0.8 correct answers for four questions guessed.
- ⚖️ The standard deviation for the guessing scenario is also calculated, coincidentally resulting in 0.8, which is the square root of the variance (4 * (1/5) * (4/5)).
- 🔑 To determine significance, the video computes the bounds of typical values by adding and subtracting two times the standard deviation from the mean.
- 🚫 The lower significance bound results in a negative number of correct guesses, which is not possible in this context, indicating that any number of correct guesses is significant if it's below this theoretical value.
- 🎯 The video concludes by determining that three correct guesses out of four is significantly high, as it exceeds the upper bound of typical values (2.4 correct guesses).
Q & A
What is the expected value or mean of a binomial probability distribution with n trials and success probability p?
-The expected value or mean is calculated by multiplying the number of trials (n) by the probability of success in one trial (p).
If there are 30 true/false questions and a 50% chance of guessing each one correctly, what is the mean number of questions one can expect to get right?
-The mean number of correct guesses would be 15, which is calculated by multiplying 30 by 0.5 (50%).
How is the variance of a binomial distribution calculated?
-The variance is calculated by multiplying the number of trials (n) by the probability of success (p) and the probability of failure (1-p).
What is the standard deviation in terms of variance?
-The standard deviation is the square root of the variance.
What does the range rule of thumb state about values within two standard deviations of the mean?
-According to the range rule of thumb, values within two standard deviations of the mean are considered typical or not significant.
How does the range rule of thumb define significantly high and significantly low values?
-Values more than two standard deviations above the mean are considered significantly high, and values more than two standard deviations below the mean are considered significantly low.
In the context of standardized tests like the SAT, what is the mean number of correct answers if one guesses on four multiple-choice questions with five possible answers?
-The mean number of correct answers is 0.8, calculated by multiplying the number of trials (4) by the probability of guessing correctly (1/5).
What is the standard deviation for guessing four multiple-choice questions with five possible answers, assuming one guesses on all?
-The standard deviation is 0.8, which is the square root of the variance calculated by multiplying the number of trials (4) by the probability of success (0.2) and the probability of failure (0.8).
How can you determine if three correct guesses out of four is significantly high using the mean and standard deviation?
-You calculate the mean plus and minus two standard deviations. If the number of correct guesses is outside this range, it is significantly high or low. In this case, three correct guesses is significantly high because it exceeds the upper limit of 2.4.
What is the lower bound for significantly low values when using the range rule of thumb with the given example?
-The lower bound for significantly low values is negative 0.8, which doesn't make practical sense in this context since you can't have a negative number of correct guesses.
What is the upper bound for significantly high values when using the range rule of thumb with the given example?
-The upper bound for significantly high values is 2.4. Any number of correct guesses greater than this is considered significantly high.
Outlines
📚 Understanding Binomial Distribution Statistics
This paragraph introduces learning outcome number four from lesson 5.2, focusing on calculating the mean, variance, and standard deviation of a binomial probability distribution. It explains the process of determining if a value is significantly high or low using the range rule of thumb. The mean is calculated by multiplying the number of trials (n) by the probability of success (p), exemplified by guessing true/false questions correctly. Variance is found by multiplying n, p, and the probability of failure (1-p), with the standard deviation being the square root of variance. The range rule of thumb is then applied to decide the significance of values based on their distance from the mean in terms of standard deviations.
🎯 Applying Statistical Measures to Guessing Multiple Choice Questions
The second paragraph delves into applying the concepts of mean and standard deviation to a practical scenario involving standardized tests with multiple-choice questions. It outlines the process of calculating the mean and standard deviation when guessing on four questions with five possible answers, each with a 1/5 chance of being correct. The mean is calculated as 0.8, indicating an average of 0.8 correct guesses per question over an infinite number of trials. The standard deviation is also 0.8, coincidentally, which is derived from the variance formula involving the number of trials, the probability of success, and failure. The significance of a particular number of correct guesses is then assessed using the range rule of thumb, which in this case, identifies three correct guesses out of four as a significantly high outcome, as it exceeds the upper limit of typical values defined by the mean plus two standard deviations.
Mindmap
Keywords
💡Binomial Probability Distribution
💡Mean
💡Variance
💡Standard Deviation
💡Range Rule of Thumb
💡Significantly High/Low
💡Multiple Choice Questions
💡Probability of Success
💡Probability of Failure
💡Significance
Highlights
The video discusses learning outcome number four from lesson 5.2, focusing on the computation of the mean, variance, and standard deviation of a binomial probability distribution.
The expected value or mean of a binomial distribution is calculated by multiplying the number of trials (n) by the probability of success (p).
An example is given with 30 true/false questions and a 50% chance of guessing correctly, resulting in an expected 15 correct answers.
Variance is calculated by multiplying the number of trials by the product of the probability of success and failure, and standard deviation is the square root of variance.
The range rule of thumb is introduced, stating that values within two standard deviations of the mean are considered typical.
Values more than two standard deviations above the mean are significantly high, and those below are significantly low.
A graphical representation of the range rule of thumb is provided, showing the distribution of values in relation to the mean.
The application of the range rule of thumb is demonstrated using standardized tests like the SAT and MCAT, which use multiple-choice questions.
The mean and standard deviation are calculated for guessing the first four questions of a test with five possible answers.
The mean number of correct answers by guessing is 0.8, representing four-fifths of a correct guess on average.
The standard deviation for the guessing scenario is also 0.8, coincidentally the same as the mean.
The concept of variance and standard deviation is explained, emphasizing their role in determining typical and significant values.
The calculation of the bounds for typical values is shown, using the mean minus and plus two standard deviations.
It is determined that a negative number of correct guesses is not possible, thus the lower bound of significance is not applicable.
The upper bound for significant guesses is calculated to be 2.4 correct answers, indicating any more is significantly high.
Three correct guesses out of four is analyzed and found to be significantly high, as it exceeds the upper limit of the typical range.
The video concludes with a summary of how to use mean and standard deviation to determine significant values and a teaser for learning outcome number five.
Transcripts
Browse More Related Video

5.1.4 Discrete Probability Distributions - The Range Rule of Thumb and Significant Values
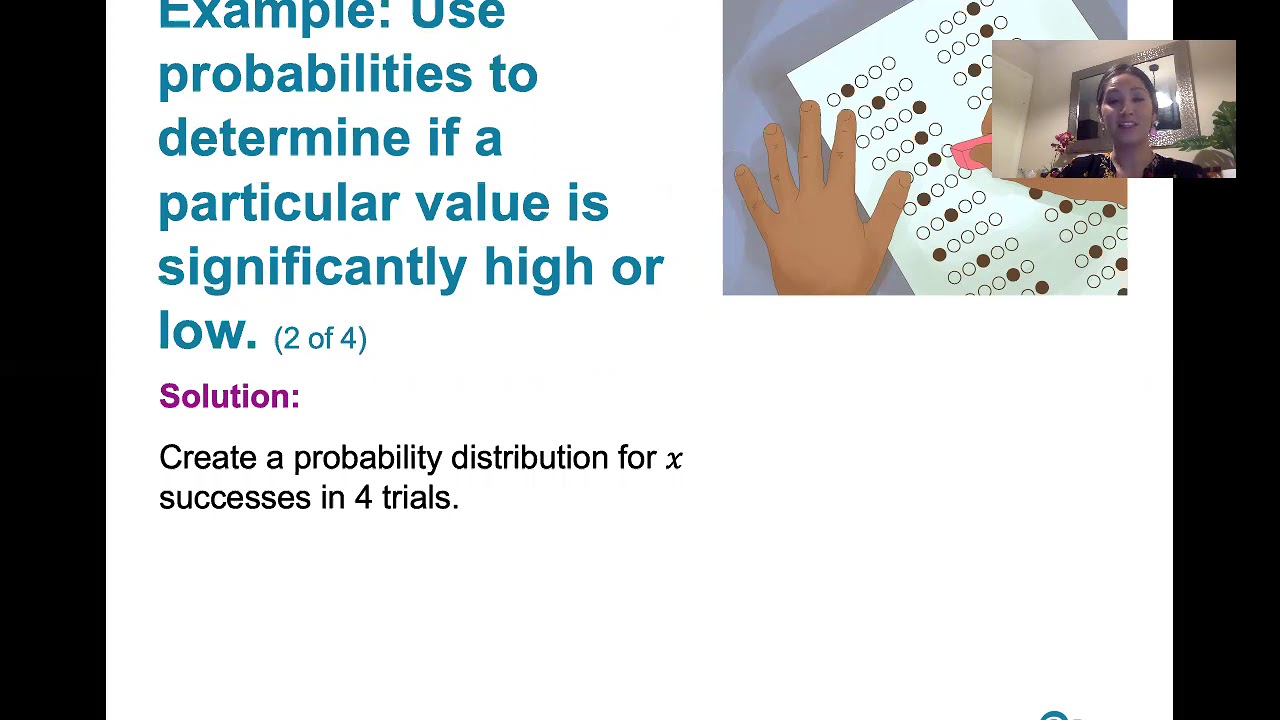
5.2.5 Binomial Probability Distributions - Using Probabilities to Determine Significance

[5.1.16] Using the Range Rule of Thumb to find significant values
5.1.5 Discrete Probability Distributions - Use Probabilities to Determine Significant Values
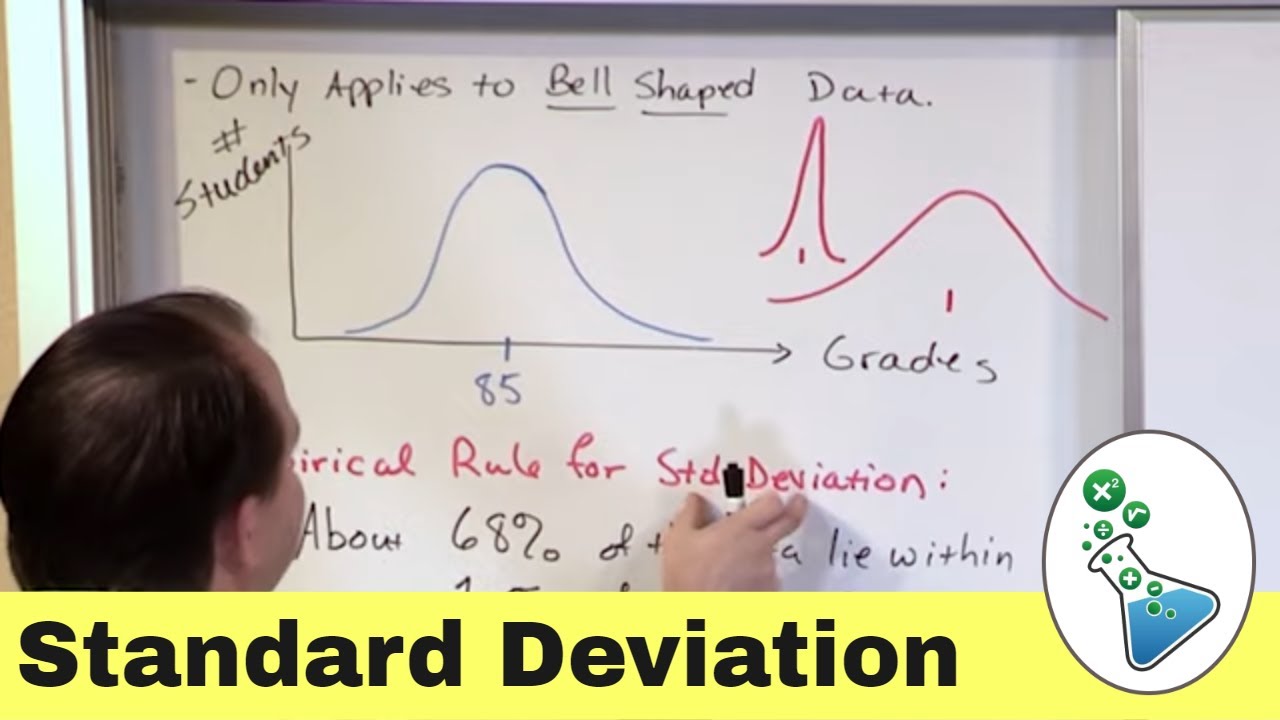
Empirical Rule of Standard Deviation in Statistics
5.1.3 Discrete Probability Distributions - Finding the Mean, Variance, and Standard Deviation
5.0 / 5 (0 votes)
Thanks for rating: