Elementary Stats Lesson #9
TLDRThis educational video script delves into the concept of discrete random variables, a fundamental topic in statistics. It revisits the idea of probability, introducing random variables as numerical measures of outcomes from experiments. The lesson covers the construction of probability distributions, the calculation of expected values, and the measurement of spread through standard deviation. Practical examples, such as insurance policies and roulette bets, illustrate the application of these concepts, emphasizing the utility of random variables in various real-world scenarios.
Takeaways
- 📚 The script is a lecture discussing the concept of random variables, focusing initially on discrete random variables.
- 🎲 A random variable, typically denoted by X or Y, is a numerical measure of the outcome of a random experiment.
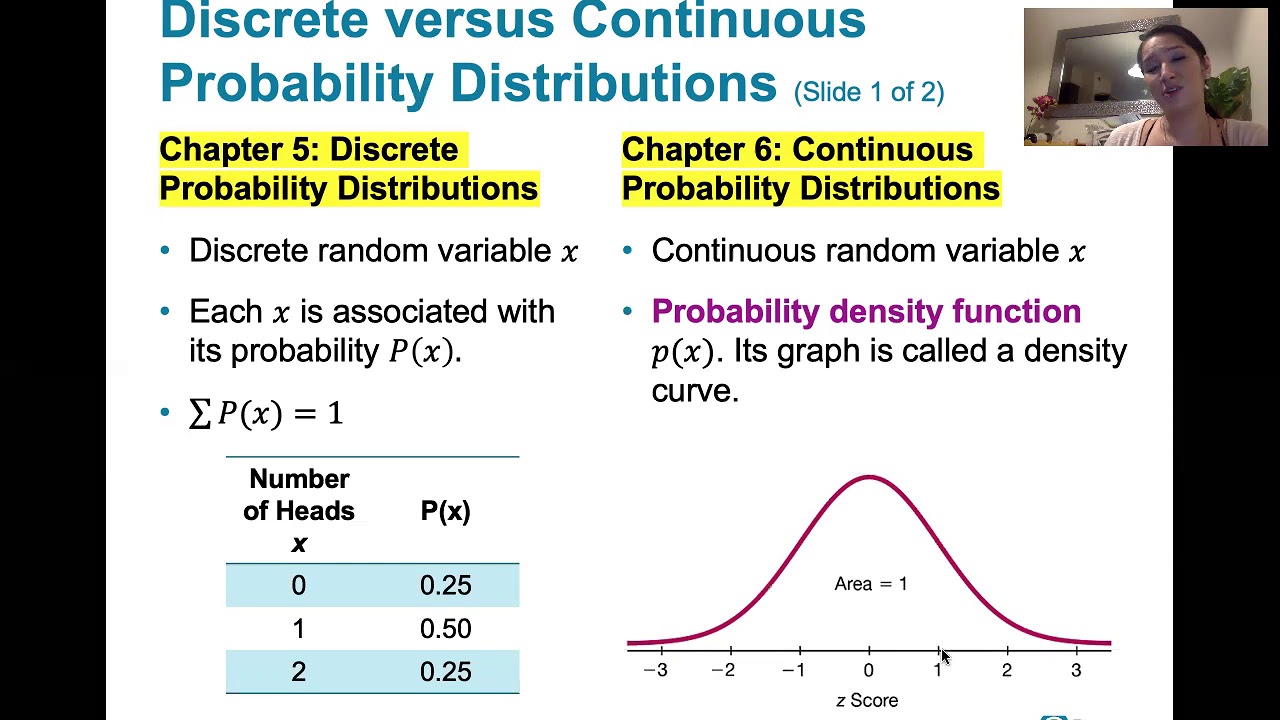
- 🔢 Discrete random variables have a countable number of possible outcomes, which can be listed.
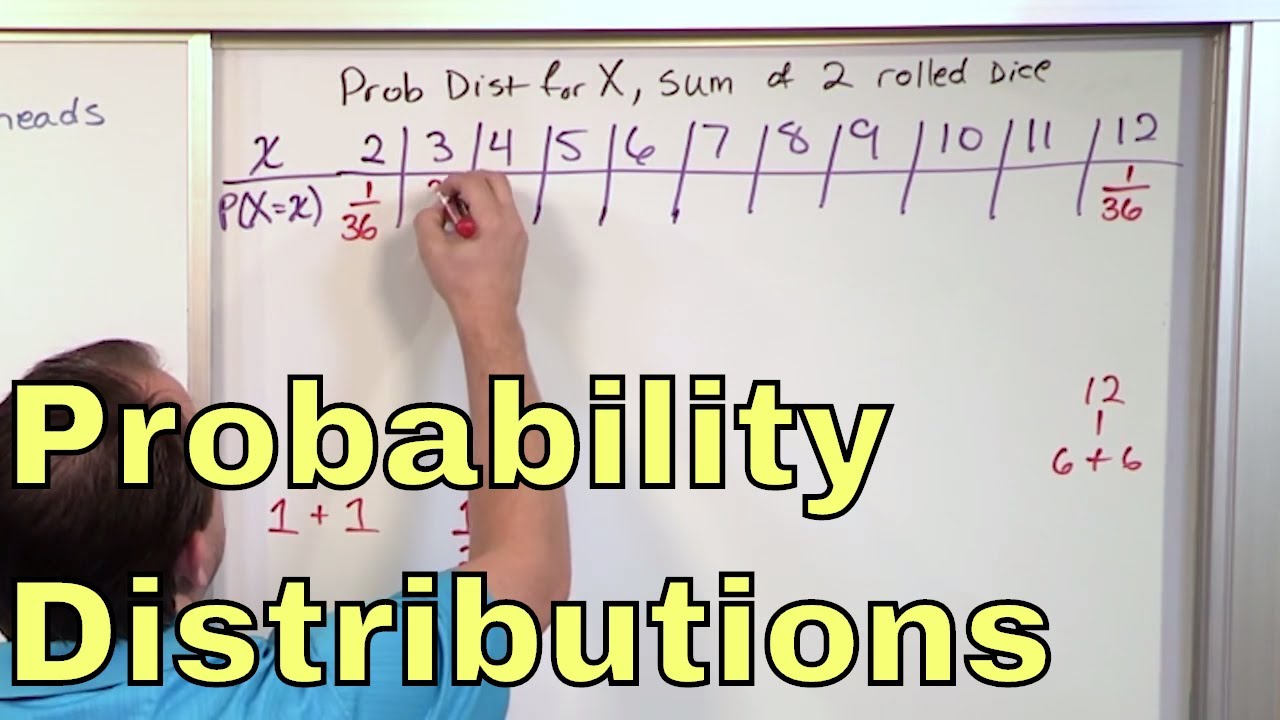
- 🈯️ The lecture introduces the concept of a probability distribution for a discrete random variable, which lists all possible values and their corresponding probabilities.
- 📊 The script explains how to create a probability histogram, which is a bar graph representation of the probability distribution of a discrete random variable.
- 🔄 The lecture emphasizes retooling previous knowledge of relative frequencies and probability to understand random variables.
- 📉 The importance of determining the shape, center, and spread of a distribution for a random variable is highlighted, along with identifying any outliers.
- 🧮 The mean (expected value) and standard deviation are key measures for describing the center and spread of a distribution for discrete random variables.
- 💡 The expected value, denoted as E(X), is used to describe the long-term average outcome of a random variable and has practical applications in various industries.
- 🎯 The script provides examples of calculating expected values in the context of insurance policies and roulette bets to illustrate the concept's applicability.
- 📝 The process of calculating the variance and standard deviation for a discrete random variable is outlined, with a mention of using a calculator to simplify the process.
Q & A
What is the main topic of Chapter Six in the transcript?
-The main topic of Chapter Six is discrete random variables, which are a simple type of random variable discussed in the context of probability and statistics.
What is a random variable in the context of the transcript?
-A random variable is a numerical measure that represents the outcome of a random experiment. It can be either discrete or continuous, and it's used to quantify the results of probabilistic events.
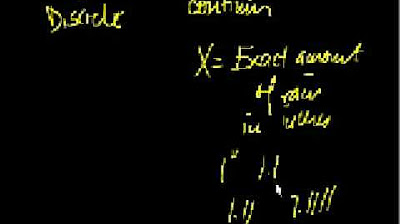
What is the difference between a discrete and a continuous random variable?
-A discrete random variable has outcomes that can be listed and counted, whereas a continuous random variable has outcomes that can be any number within a certain interval, not just counting numbers.
What is a probability distribution for a discrete random variable?
-A probability distribution for a discrete random variable lists all possible values of the variable along with their corresponding probabilities, showing the likelihood of each outcome.
How is the mean of a discrete random variable calculated?
-The mean (or expected value) of a discrete random variable is calculated by summing the products of each outcome and its corresponding probability, which represents a weighted average based on the likelihood of each outcome.
What is the purpose of a probability histogram for a discrete random variable?
-A probability histogram, although not a true histogram due to the discrete nature of the variable, is used to visually represent the probability distribution of a discrete random variable, showing the probability of each possible outcome.
What is the expected value of a one-year term life insurance policy for a 49-year-old female, according to the transcript?
-The expected value of the one-year term life insurance policy for a 49-year-old female is a profit of $7.50 per policy for the insurance company, when a large number of these policies are sold.
What is the expected value of a $100 bet on red in a standard American roulette wheel, from the player's perspective?
-From the player's perspective, the expected value of a $100 bet on red in a standard American roulette wheel is a loss of $5.30 per bet in the long run.
How is the standard deviation of a discrete random variable calculated?
-The standard deviation of a discrete random variable is calculated by first determining the variance, which is the sum of the weighted squared deviations from the mean (each outcome minus the mean, squared, and then weighted by its probability). The standard deviation is then the square root of the variance.
What is the significance of calculating the mean and standard deviation of a random variable in the context of the transcript?
-Calculating the mean and standard deviation of a random variable helps in understanding the central tendency and dispersion of the data, respectively. These measures provide insights into the expected outcomes and the spread of the distribution, which are crucial for making informed decisions and predictions.
How can the TI calculator be used to calculate the mean and standard deviation of a discrete random variable?
-The TI calculator can be used to calculate the mean and standard deviation of a discrete random variable by entering the possible outcomes in List 1 and their corresponding probabilities in List 2. Then, running the '1-Var Stats' program with these lists will provide the mean and standard deviation based on the full probability distribution.
What is the probability that fewer than four goals were scored in a randomly chosen World Cup soccer championship game, according to the transcript?
-The probability that fewer than four goals were scored in a randomly chosen World Cup soccer championship game is approximately 74%, which is calculated by adding the probabilities of scoring one, two, or three goals.
Outlines
🎓 Introduction to Discrete Random Variables
The script begins with an introduction to the topic of random variables, specifically focusing on discrete random variables in Chapter Six. The instructor sets the stage for Lesson Nine, noting the transition into the second half of the semester. The concept of probability is revisited, with its definition as the long-term relative frequency of an event. A new concept, the random variable, is introduced as a numerical measure of the outcome of a random experiment, exemplified by a coin-tossing experiment. The instructor also touches on the distinction between discrete and continuous random variables, with discrete variables having a countable number of possible outcomes.
📊 Understanding Probability Distributions for Discrete Variables
This paragraph delves deeper into the concept of probability distributions for discrete random variables. The instructor explains how these distributions list all possible outcomes and their corresponding probabilities. Using the coin-tossing experiment, a probability distribution is constructed to show the likelihood of different numbers of heads appearing. The script also introduces the idea of a probability histogram, a visual representation of the distribution, and discusses the familiarity of the concepts with previous lessons, emphasizing the reuse of knowledge about relative frequencies and probability tools.
📈 Analyzing the Video Rental Store Example
The script presents a real-world example involving a video rental store to illustrate the application of probability distributions. It discusses the probability distribution of the number of videos rented per customer visit, highlighting the most likely outcomes. The instructor constructs a probability histogram for this distribution and explains how to interpret the shape, center, and spread of the distribution. The importance of understanding the shape, center, and spread is emphasized, along with the identification of any outliers.
🧮 Calculating the Mean and Standard Deviation
The instructor explains how to calculate the mean (expected value) and standard deviation for a discrete random variable, using the video rental example. The mean is computed as a weighted average, taking into account the probabilities of each outcome. The standard deviation is introduced as a measure of the spread of the distribution. The process involves calculating deviations from the mean, squaring them, weighting them by their probabilities, and then taking the square root of the sum of these weighted squared deviations.
🎰 Applications of Expected Value in Real Life
The script explores the practical applications of the expected value, using examples from life insurance and roulette betting. The life insurance example demonstrates how to calculate the expected profit for an insurance company when selling a term life insurance policy. The roulette example calculates the expected loss for a player making a bet on red in American roulette. These examples highlight the utility of expected value in predicting long-term outcomes and making informed decisions.
🏆 World Cup Soccer Tournament Analysis
In the final paragraph, the instructor uses the World Cup soccer tournament as an example to illustrate the process of constructing a probability distribution from historical data. The number of goals scored by the winning team in each championship game is the random variable of interest. The script guides through the process of converting frequencies to probabilities, constructing the probability distribution, and drawing a probability histogram to visualize the distribution's shape. It also discusses the computation of the mean and standard deviation for this distribution, providing a comprehensive analysis of the data.
Mindmap
Keywords
💡Random Variables
💡Discrete Random Variables
💡Probability Distribution
💡Expected Value
💡Standard Deviation
💡Variance
💡Probability Histogram
💡Continuous Random Variables
💡Mean
💡Skewness
Highlights
Introduction to discrete random variables in Chapter 6, building upon previous knowledge with a focus on numerical outcomes.
Retooling knowledge of single variable data sets to incorporate probability into the analysis.
Definition and explanation of a random variable as a numerical measure of an outcome from a probability experiment.
Example of a random experiment involving a coin toss to illustrate the concept of a random variable.
Differentiation between discrete and continuous random variables, with discrete variables having countable outcomes.
Explanation of the probability distribution for a discrete random variable, listing possible values and their probabilities.
Construction of a probability histogram to visualize the distribution of a discrete random variable.
Analysis of the shape, center, spread, and outliers of a probability distribution as key characteristics.
Calculation of the mean (expected value) for a discrete random variable using weighted outcomes.
Application of the expected value concept in the context of a life insurance policy to determine profitability.
Use of the standard deviation to measure the spread of a probability distribution for discrete random variables.
Practical example of calculating the expected value of a bet in American roulette to analyze player expectations.
Process of calculating variance and standard deviation for a discrete random variable, emphasizing the importance of weighted contributions.
Utilization of technology, such as a calculator, to simplify the computation of mean and standard deviation.
Real-world application of discrete random variables in analyzing the number of goals scored in World Cup soccer games.
Instruction on using a calculator to compute statistics for a probability distribution, streamlining the process.
Importance of understanding discrete random variables for statisticians when sampling from populations.
Upcoming lesson预告 on binomial distributions, indicating a progression in the study of discrete random variables.
Transcripts
Browse More Related Video

5. Discrete Random Variables I

5.1.0 Discrete Probability Distributions - Lesson Overview and Learning Outcomes
Introduction to Random Variables

Elementary Statistics - Chapter 5 Probability Distributions Part 1
02 - Random Variables and Discrete Probability Distributions
6.1.1 The Standard Normal Distribution - Discrete and Continuous Probability Distributions
5.0 / 5 (0 votes)
Thanks for rating: