5.1.0 Discrete Probability Distributions - Lesson Overview and Learning Outcomes
TLDRThis video introduces Lesson 5.1 on discrete probability distributions, combining concepts from previous chapters to create a theoretical model of expected outcomes. The instructor modifies existing slides with graphics and examples for clarity. The lesson covers defining random variables, identifying probability distributions, and calculating population parameters like mean and standard deviation. It also teaches evaluating significant values and applying expected value to make informed decisions, particularly in gambling scenarios.
Takeaways
- 📚 The video discusses Lesson 5.1 on discrete probability distributions, focusing on the integration of concepts from previous chapters.
- 📈 The slides are a combination of Pearson's slides and those shared by James Lily, a statistics professor, and have been modified for clarity and additional examples.
- 🎯 Chapter Five is about discrete probability distributions, with the first section introducing the concept and the second focusing on binomial probability distributions.
- 📘 The textbook reference is 'Essentials of Statistics, Sixth Edition' by Mario Triola, which is the basis for the course content.
- 🔢 Descriptive statistics from chapters two and three involve summarizing and organizing data, finding measures of central tendency, variation, and relative standing.
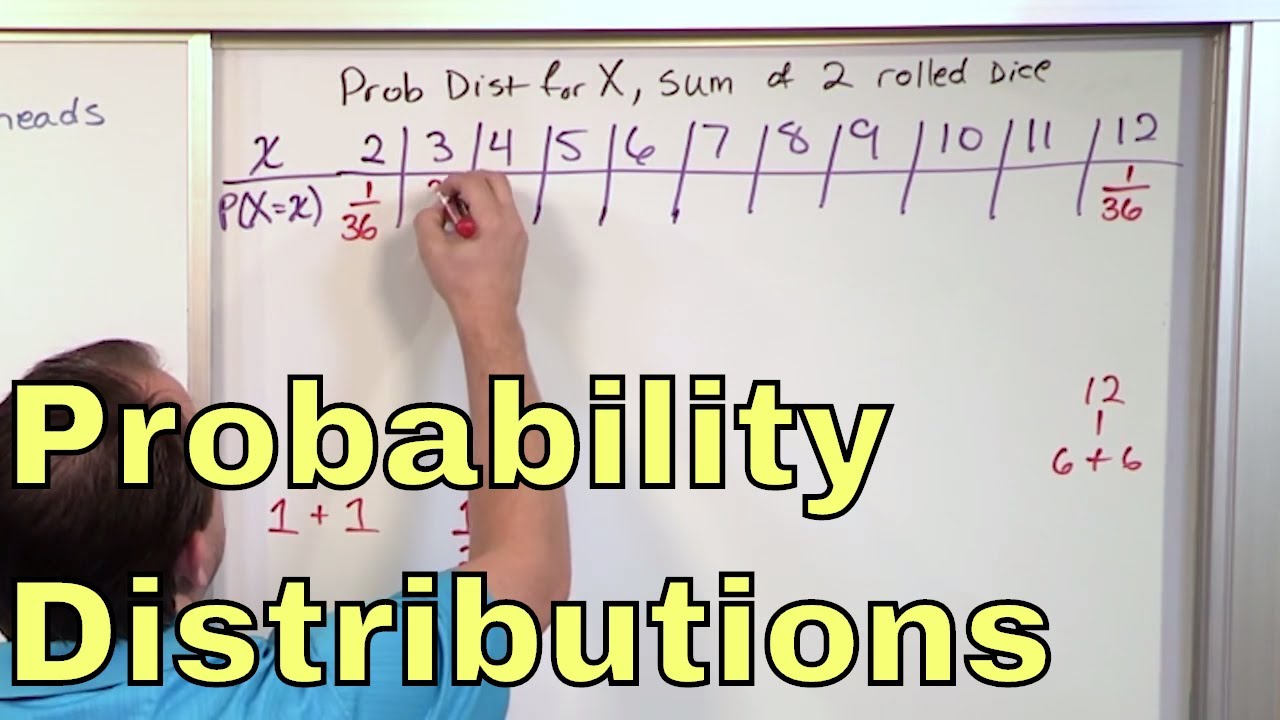
- 🎲 Chapter four introduced finding probabilities using theoretical approaches, such as calculating the likelihood of outcomes in a coin toss experiment.
- 🧩 Chapter five combines these concepts to create a theoretical model of expected results using probability distributions, rather than actual results from a sample.
- 📊 A probability distribution table is used to find the population mean and standard deviation, which are characteristics of the entire population, not just a sample.
- 🎯 The video outlines six learning outcomes for section 5.1, including defining random variables, understanding probability distributions, and applying expected value to decision-making.
- 📊 Visualization of probability distributions is done using probability histograms, which differ from frequency histograms by showing expected probabilities instead of actual counts.
- 📉 Determining whether a value is significantly high or low is part of the learning outcomes, using both the range rule of thumb and probability calculations.
- 🎲 The application of expected value is demonstrated through gambling problems, allowing viewers to compare the expected outcomes of different games to make informed decisions.
Q & A
What is the main topic of Lesson 5.1 in the video?
-The main topic of Lesson 5.1 is discrete probability distributions.
Who provided the original slides for the video?
-The original slides were provided by Pearson and James Lily from Tulsa Community College.
What modifications were made to the original slides for the course?
-Modifications include adding graphics, changing wording, adding extra examples, pictures, phrases, and paragraphs for clarification.
What is the purpose of combining ideas from Chapters 2, 3, and 4 in Chapter 5?
-The purpose is to create a theoretical model of expected results using probabilities, combining the process of summarizing and organizing data with finding probabilities.
What are the two main types of statistics mentioned in the script?
-Descriptive statistics and probability distributions.
How does Chapter 5 differ from Chapters 2 and 3 in terms of results?
-Chapter 5 is about expected results using probabilities, while Chapters 2 and 3 are about summarizing and describing actual results from sample data.
What is the significance of finding a sample mean and standard deviation in the context of the script?
-Finding a sample mean and standard deviation helps in summarizing and organizing data from actual trials or experiments.
What is a probability distribution table used for according to the script?
-A probability distribution table is used to describe what is expected to happen and to find population mean and standard deviation.
What are the six learning outcomes mentioned in the script for Lesson 5.1?
-The learning outcomes include defining a random variable, determining if a table represents a probability distribution, visualizing a probability distribution, finding population mean, variance, and standard deviation, determining significantly high or low values, and applying expected value to make decisions.
How does the script differentiate between frequencies and probabilities in the context of data analysis?
-Frequencies are counts of actual occurrences, while probabilities are expectations for what is thought to happen based on theoretical models.
What is the script's approach to teaching the concept of expected value?
-The script teaches expected value by comparing it to actual results from past events and using it to make decisions in scenarios like gambling problems.
Outlines
📚 Introduction to Discrete Probability Distributions
This paragraph introduces Lesson 5.1, focusing on discrete probability distributions. The instructor discusses the source of the slides, which are a combination of Pearson's materials and contributions from James Lily, a statistics professor at Tulsa Community College. The instructor has modified these resources by adding graphics, examples, and clarifications to better support students in their coursework and exam preparation. The lesson is part of a broader chapter on discrete probability distributions from the textbook 'Essentials of Statistics, Sixth Edition' by Mario Triola. The chapter aims to integrate concepts from previous chapters on data summarization and visualization with the calculation of probabilities to create expected results rather than actual results. The instructor emphasizes the difference between descriptive statistics, which deal with actual sample data, and the expectations set forth in chapter five, which involve theoretical models and probabilities.
🎯 Combining Data Analysis with Probability Theory
The second paragraph delves into the practical application of combining data analysis techniques with probability theory. It uses the example of a coin-tossing experiment, where the number of heads in 100 trials is recorded to create a frequency distribution. From this, sample mean and standard deviation can be calculated. The instructor then contrasts this with the theoretical approach of calculating the probabilities of getting zero, one, or two heads when tossing a coin twice, using the classical approach. The chapter's goal is to merge these two methodologies, resulting in a theoretical model that predicts expected outcomes based on probabilities. The instructor outlines the chapter's learning outcomes, which include defining random variables, understanding and verifying probability distributions, visualizing them with histograms, and calculating population mean, variance, and standard deviation. Additionally, the learning outcomes cover determining significant values of random variables and applying expected value to decision-making, such as in gambling scenarios.
Mindmap
Keywords
💡Discrete Probability Distributions
💡Descriptive Statistics
💡Sample Mean
💡Sample Standard Deviation
💡Probability
💡Sample Space
💡Population Mean
💡Population Standard Deviation
💡Expected Value
💡Learning Outcomes
💡Range Rule of Thumb
Highlights
The video discusses Lesson 5.1 on discrete probability distributions.
The slides are a combination of Pearson's and James Lily's materials from Tulsa Community College.
The instructor modified the slides by adding graphics, changing wording, and including extra examples for clarity.
Chapter five focuses on discrete probability distributions, with two sections covered due to time constraints.
The first section introduces discrete probability distributions, while the second discusses binomial probability distributions.
The textbook reference is 'Essentials of Statistics, Sixth Edition' by Mario Triola.
Chapter five combines ideas from previous chapters on data summarization and probability.
Descriptive statistics from chapters two and three are contrasted with the expected results of chapter five.
The video explains the process of creating a frequency distribution from 100 trials of two coin tosses.
Sample mean and standard deviation can be calculated from the frequency distribution.
The classical approach to probability is used to determine the likelihood of different outcomes in coin tosses.
Chapter five aims to create a theoretical model of expected results using probabilities.
A visual representation of the theoretical model is provided, comparing actual results with expected probabilities.
There are six learning outcomes for section 5.1, starting with defining a random variable.
The learning outcomes include understanding probability distributions, visualizing them, and calculating population parameters.
The video will also cover determining significant values of a random variable using the range rule of thumb and probabilities.
The final learning outcome is applying expected value to make decisions, such as in gambling problems.
The video concludes with an overview of the content covered in the next video, focusing on the first learning outcome.
Transcripts
Browse More Related Video


5.0 / 5 (0 votes)
Thanks for rating: