02 - Random Variables and Discrete Probability Distributions
TLDRThis lesson in mastering statistics introduces core concepts of random variables and discrete probability distributions. The instructor demystifies these terms by explaining that a random variable is an outcome of a random experiment, differing from regular algebraic variables. Discrete probability distributions are tables or formulas that list the probabilities of each outcome for a random variable, exemplified through coin flips and dice rolls. The lesson emphasizes the importance of understanding that the sum of probabilities in a distribution equals 1, ensuring all possible outcomes are covered. The concepts are foundational for further statistical analysis.
Takeaways
- 📚 The lesson focuses on understanding random variables and discrete probability distributions, which are fundamental in statistics.
- 🔄 A random variable in statistics is an outcome of a random experiment, unlike algebraic variables which have fixed values.
- 🃏 The script uses the example of drawing cards or flipping coins to illustrate how random variables are determined by chance.
- 📉 Discrete probability distribution is represented as a table or formula that lists the probabilities for each outcome of a random variable.
- 🎲 The example of flipping three coins is given to demonstrate calculating the probability distribution for different numbers of heads.
- 📊 The sum of probabilities in a discrete probability distribution must equal 1, ensuring all possible outcomes of an experiment are accounted for.
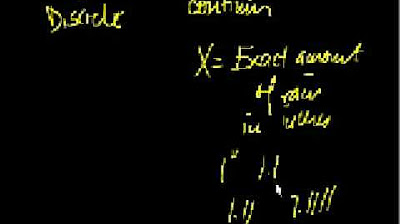
- 👉 The concept of 'discrete' refers to outcomes that can only take on certain, finite values, unlike 'continuous' which can have infinite values between any two points.
- 👓 Real-world examples like people's heights are often continuous, as opposed to the discrete outcomes of coin flips or dice rolls.
- 🎯 The script emphasizes the importance of understanding probability distributions as they form the basis for further statistical analysis.
- 🧩 The lesson also touches on how to calculate probabilities for combined events, such as the sum of two dice rolls.
- 🔢 The probability distribution for the sum of two dice is created by determining the number of ways to achieve each possible sum out of 36 total outcomes.
Q & A
What is the main focus of this statistics lesson?
-The main focus of this statistics lesson is to explain the core concepts of random variables and discrete probability distributions, making them easy to understand for the students.
What is a random variable in the context of statistics?
-In statistics, a random variable is a variable whose value is determined by a random experiment, such as drawing cards from a deck or flipping coins.
How is a random variable different from a regular variable in algebra?
-A random variable is different from a regular variable in algebra because it represents the outcome of an experiment, which can change each time the experiment is conducted, whereas an algebraic variable has a fixed value when the equation is solved.
What is a discrete probability distribution?
-A discrete probability distribution is a table or formula that lists the probabilities for each outcome of a random variable, X.
Why are discrete probability distributions often represented as tables?
-Discrete probability distributions are often represented as tables because they allow for a clear and organized presentation of all possible outcomes and their associated probabilities.
Can you give an example of a random experiment?
-An example of a random experiment is flipping three coins at the same time and observing the number of heads that show.
What is the significance of the sum of all probabilities in a probability distribution?
-The sum of all probabilities in a probability distribution must equal 1, which signifies that the experiment will always result in one of the possible outcomes, covering 100% of the chance of the event occurring.
What is the meaning of the term 'discrete' in the context of probability distributions?
-In the context of probability distributions, 'discrete' means that the random variable can only take on certain specific values, as opposed to continuous variables that can take on a range of values.
How does the concept of a discrete probability distribution apply to rolling two dice?
-The concept of a discrete probability distribution applies to rolling two dice by determining the probability of obtaining different sums of the dice, with each sum representing a discrete outcome.
What is the maximum sum that can be obtained when rolling two six-sided dice?
-The maximum sum that can be obtained when rolling two six-sided dice is 12, which occurs when both dice show a 6.
How can you calculate the probability of a certain event, such as getting a sum less than or equal to 3 when rolling two dice?
-To calculate the probability of an event like getting a sum less than or equal to 3 when rolling two dice, you add the probabilities of the individual outcomes that satisfy the condition (e.g., sum of 2 and sum of 3) and divide by the total number of possible outcomes (36 in the case of two dice).
Outlines
📚 Introduction to Statistics and Random Variables
The script begins with an introduction to the core concepts of statistics, focusing on random variables and discrete probability distributions. It aims to demystify these concepts, which can be intimidating to students. The instructor emphasizes that a random variable is an outcome of a random experiment, contrasting it with the variables in algebra. Examples like drawing cards from a deck are used to illustrate the concept. The lesson promises to clarify definitions and concepts through examples, making the abstract ideas more tangible.
🃏 Understanding Discrete Probability Distributions
This paragraph delves into discrete probability distributions, explaining them as tables or formulas that list the probabilities for each outcome of a random variable, often denoted as capital X in statistics. The script uses the example of flipping three coins to create a tangible scenario for understanding distributions. It outlines the possible outcomes and their respective probabilities, emphasizing the discrete nature of the outcomes, which can be distinctly counted and listed in a table, unlike continuous variables that can take on an infinite range of values.
🎲 Coin Flip Experiment and Probability Calculation
The script continues with a detailed example of flipping three coins to demonstrate how to calculate the probability distribution of getting a certain number of heads. It breaks down the eight possible outcomes and their corresponding probabilities, illustrating how the number of ways an outcome can occur affects its likelihood. The instructor shows how to create a table of outcomes and their associated probabilities, reinforcing the concept of discrete probability distribution by highlighting that the sum of all probabilities must equal 1, ensuring all possible outcomes are accounted for.
🔢 The Concept of Discrete and Continuous Variables
This section clarifies the difference between discrete and continuous variables. Discrete variables are those that can take on only certain distinct values, such as the number of heads in a coin flip, which can only be a whole number. In contrast, continuous variables can have an infinite number of values within a range, like human height. The script points out that while the current discussion is focused on discrete distributions, most real-world statistical problems involve continuous distributions, setting the stage for further lessons.
🎯 Summing Probabilities in a Discrete Distribution
The script emphasizes the importance of the sum of probabilities in a discrete distribution equaling 1, which signifies that all possible outcomes of an experiment are covered. It provides an example using the outcomes of rolling two dice, explaining how to calculate the probability of different sums and how these probabilities sum up to 1. This reinforces the concept that the total probability must account for every possible outcome of the experiment, ensuring a complete understanding of discrete probability distributions.
🎲 Probability Distribution of Dice Rolls and Summation
The final paragraph provides a comprehensive example of creating a probability distribution for the sum of two rolled dice. It explains how to determine the possible sums and their respective probabilities, given the discrete nature of the outcomes. The instructor demonstrates how to calculate the number of ways each sum can occur out of the total 36 possible dice roll combinations. The summary also shows how to use the distribution to find the probability of a sum being less than or equal to a certain number by summing the relevant probabilities, highlighting the practical application of understanding discrete probability distributions.
Mindmap
Keywords
💡Random Variables
💡Discrete Probability Distributions
💡Experiments
💡Probability
💡Algebraic Variables
💡Outcomes
💡Continuous Variables
💡Sum of Probabilities
💡Combination
💡Statistical Process
Highlights
Introduction to the core concepts of statistics, focusing on random variables and discrete probability distributions.
Clarification that a random variable in statistics is an outcome of a random experiment, unlike variables in algebra.
Explanation of how the value of a random variable is determined by repeating an experiment multiple times.
Definition of a discrete probability distribution as a table or formula listing probabilities for each outcome of a random variable.
Use of capital X to represent a random variable in statistics, distinguishing it from algebraic notation.
Illustration of a probability distribution with an example of flipping three coins and counting the number of heads.
Visualization technique using a raw representation of outcomes to understand the likelihood of different results.
Conversion of raw outcomes into a probability distribution table for the three-coin flip experiment.
Calculation of probabilities for each outcome, demonstrating how to determine the likelihood of getting a certain number of heads.
Emphasis on the importance of the sum of probabilities in a distribution equaling 1, representing all possible outcomes.
Introduction of a second example involving the sum of two rolled dice to explain discrete probability distributions further.
Explanation of how to calculate the probability distribution for the sum of two dice, detailing the process for each possible sum.
Discussion on the discrete nature of the dice sum experiment, contrasting it with continuous variables like height.
Highlighting that most real-world statistics problems involve continuous distributions rather than discrete ones.
Demonstration of how to use a probability distribution table to calculate probabilities for ranges of outcomes, such as sums less than or equal to a certain number.
Conclusion emphasizing the foundational role of understanding probability distributions for further statistical analysis.
Transcripts
Browse More Related Video
Introduction to Random Variables
5.1.2 Discrete Probability Distributions - Probability Distributions and Probability Histograms
Introduction to Discrete Random Variables and Discrete Probability Distributions

Random variables | Probability and Statistics | Khan Academy

Session 40 - Probability Distribution Functions - PDF, PMF & CDF | DSMP 2023

Constructing a probability distribution for random variable | Khan Academy
5.0 / 5 (0 votes)
Thanks for rating: