The Change in Producer Surplus
TLDRIn this educational video, the speaker introduces the concept of producer surplus (PS) using a smart pen and special paper. They explain PS as the incentive for suppliers to produce goods, illustrating it with a supply curve and demonstrating how it changes with price fluctuations. The video provides a clear example, calculating the change in PS when the price increases from $3 to $10 and the quantity jumps from 10 to 30 units, showing that an increase in price leads to greater producer surplus, benefiting producers.
Takeaways
- 🖊 The video uses a smart pen and special paper to record content, with the pen's ability to capture audio and video.
- 🎥 The creator mentions the challenges of achieving good background, lighting, and sound in video recordings.
- 📈 The topic of the video is 'Producer Surplus' (PS), which is an economic concept related to suppliers and their incentives to produce goods.
- 📊 A supply curve is drawn to visually represent the relationship between price and quantity supplied, with producer surplus depicted as the area under the curve.
- 💰 Producer surplus is likened to profit but is not exactly the same, as producers can operate at a loss in the short run.
- 📉 The video discusses how producer surplus changes with price and quantity adjustments, using diagrams to illustrate the concept.
- 📈 An increase in price leads to an increase in quantity supplied, which in turn affects the producer surplus positively.
- 📐 The change in producer surplus is calculated using the formula for the area of a trapezoid, with an example provided to demonstrate the calculation.
- 🔢 The formula for the change in producer surplus is given as \( \frac{1}{2}(p2 - p1) \times (q1 + q2) \), where \( p1 \) and \( p2 \) are the initial and new prices, and \( q1 \) and \( q2 \) are the initial and new quantities.
- 📉 The video contrasts producer surplus with consumer surplus, noting the negative sign in the consumer surplus formula due to the downward slope of the demand curve.
- 📈 The final example in the video shows a positive change in producer surplus when the price increases from $3 to $10, with quantities changing from 10 to 30 units.
- 🎉 The video concludes by emphasizing that a positive change in producer surplus indicates producers are better off with higher prices.
Q & A
What is the main topic discussed in the video script?
-The main topic discussed in the video script is producer surplus, which is abbreviated as PS.
What is a producer surplus and why is it important?
-Producer surplus is the difference between the price at which producers are willing to sell a good and the actual market price. It represents the incentive for producers to supply goods and can be thought of as a form of profit, although it's not always exactly equal to profit.
How does the speaker describe the process of recording the video?
-The speaker uses a smart pen and special paper to record the video, which has the capability of picking up audio and video. However, the speaker usually doesn't pick up audio and video due to the difficulty of getting the right background, lighting, and sound.
What is the graphical representation of producer surplus in the script?
-Producer surplus is graphically represented as the area above the supply curve and below the market price up to the quantity being sold.
What happens to the producer surplus when the market price increases?
-When the market price increases, producers respond by producing more goods. The new producer surplus is the area below the new price and above the supply curve, which is larger than the previous surplus, indicating an increase in the producers' earnings.
What is the formula for calculating the change in producer surplus when the price changes?
-The change in producer surplus (ΔPS) is calculated as one half of the difference between the new price (P2) and the old price (P1), multiplied by the sum of the initial quantity (Q1) and the new quantity (Q2): ΔPS = 1/2 * (P2 - P1) * (Q1 + Q2).
Why is the change in producer surplus always a positive number?
-The change in producer surplus is always a positive number because it represents an increase in the area under the price line and above the supply curve, indicating that producers are earning more when the price goes up.
What is the difference between producer surplus and profit?
-While producer surplus is similar to profit, it is not exactly the same. Producer surplus can be less than, equal to, or even greater than profit, depending on the costs of production. It's important to note that producers can operate at a loss in the short run, which is why producer surplus isn't always profit.
How does the speaker illustrate the concept of producer surplus with an example?
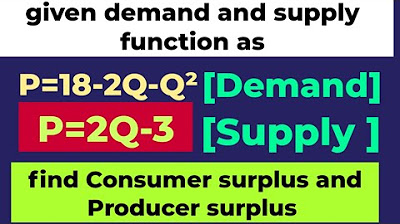
-The speaker provides an example where the initial price (P1) is $3 and the quantity (Q1) is 10 units. When the price increases to a new price (P2) of $10, the quantity produced increases to Q2, which is 30 units. The change in producer surplus is then calculated using the formula provided.
What is the significance of the negative sign in the formula for the change in consumer surplus?
-The negative sign in the formula for the change in consumer surplus indicates that as price increases, consumer surplus decreases, which is consistent with the downward slope of the demand curve.
What does the speaker emphasize about the importance of the change in producer surplus being greater than zero?
-The speaker emphasizes that a positive change in producer surplus indicates that producers are better off with the price increase, which is a desirable outcome for them as it signals higher earnings.
Outlines
🖌️ Introduction to Smart Pen and Producer Surplus
The speaker introduces their use of a smart pen and special paper to record videos, which can capture audio and video, although they usually avoid it due to the difficulty of perfecting background, lighting, and sound. Today, they decide to experiment with it. The main topic is Producer Surplus (PS), which represents the supplier's incentive to produce goods. The speaker explains PS by drawing a supply curve and illustrating it with an example, comparing it to profit but noting the difference due to producers sometimes operating at a loss in the short run. The concept is further explored by considering the effect of price and quantity changes on PS.
📈 Analyzing Changes in Producer Surplus
The speaker continues the discussion on Producer Surplus by drawing a new diagram to demonstrate how changes in price and quantity affect it. They introduce a formula for calculating the change in PS, using a trapezoid area as an analogy. The formula involves the difference in prices and the quantities before and after the price change. The speaker emphasizes that the change in PS is represented by the area between the two prices and above the supply curve, not the entire triangle under the supply curve. They provide a step-by-step guide to calculating the change in PS, including a mathematical example with specific price and quantity values, and explain the significance of the positive result indicating an increase in producer surplus.
📊 Conclusion on Producer Surplus and Encouragement to Subscribe
In the final paragraph, the speaker concludes the video by emphasizing the importance of a higher price for producers, as it leads to an increase in producer surplus, which is desirable for suppliers. They highlight that a positive change in producer surplus indicates that producers are better off with the price increase. The speaker then invites viewers to subscribe to their channel for updates on future videos, and the video ends with a piece of music.
Mindmap
Keywords
💡Smart Pen
💡Producer Surplus (PS)
💡Supply Curve
💡Price
💡Quantity
💡Incentive
💡Change in Producer Surplus (ΔPS)
💡Trapezoid
💡Formula
💡Negative Sign
💡Profit
Highlights
Using a smart pen and special paper to record videos with both audio and video capabilities.
Explanation of why audio and video recording is usually avoided due to difficulties in achieving decent background, lighting, and sound.
Introduction to the concept of producer surplus (PS) and its importance in economics.
Description of the supply curve and how to label axes correctly in economic graphs.
Visualization of producer surplus as the area under the supply curve and above the price level.
Clarification that producer surplus is not exactly profit, but rather an incentive for producing goods.
Demonstration of how changes in price affect producer surplus, using a new supply curve diagram.
Illustration of the change in producer surplus (delta PS) when the price increases.
Explanation of how to calculate the area of the trapezoid representing the change in producer surplus.
Detailed step-by-step example with specific prices and quantities to calculate the change in producer surplus.
Introduction of the concept of consumer surplus and its relationship to producer surplus.
Explanation of the negative sign in the consumer surplus formula due to the downward sloping demand curve.
Reinforcement that a positive change in producer surplus indicates an increase in producer happiness.
Emphasis on the importance of higher prices for producers, as they prefer selling at higher prices rather than lower.
Encouragement to watch related videos and subscribe for updates.
Transcripts
Browse More Related Video

Business Calculus: Producer and Consumer Surplus

Producer surplus | Consumer and producer surplus | Microeconomics | Khan Academy

What is Consumers Surplus and Producer Surplus?

How to calculate the impact of import and export tariffs.
consumer surplus and producer surplus
Consumer Surplus (CS) and Producer Surplus (PS) Example
5.0 / 5 (0 votes)
Thanks for rating: