Producer surplus | Consumer and producer surplus | Microeconomics | Khan Academy
TLDRThis script explores the concept of producer surplus in the context of a berry farm, illustrating how the supply curve represents the opportunity cost for producers. It explains that the price producers receive for their goods must at least cover these costs to incentivize production. The script uses a linear supply and demand model to calculate the producer surplus, demonstrating that it is the area above the supply curve and below the market price, resulting in a surplus of $6,000 per week for the berry producers.
Takeaways
- 📈 The script discusses the concept of the supply curve and producer surplus, complementing the previously discussed demand curve and consumer surplus.
- 🌱 It uses the example of a berry farm to illustrate the supply curve, explaining how producers determine the quantity of goods they are willing to supply at various price levels.
- 💰 The opportunity cost is highlighted as the minimum price producers need to be compensated to produce a certain quantity of goods, reflecting alternative uses of their resources.
- 📊 The script describes how the supply curve can be viewed as an opportunity cost curve, showing the incremental costs of producing additional quantities of goods.
- 🔄 As more quantity is produced, producers may have to use less suitable resources, which increases the opportunity cost and thus the price needed to produce those additional goods.
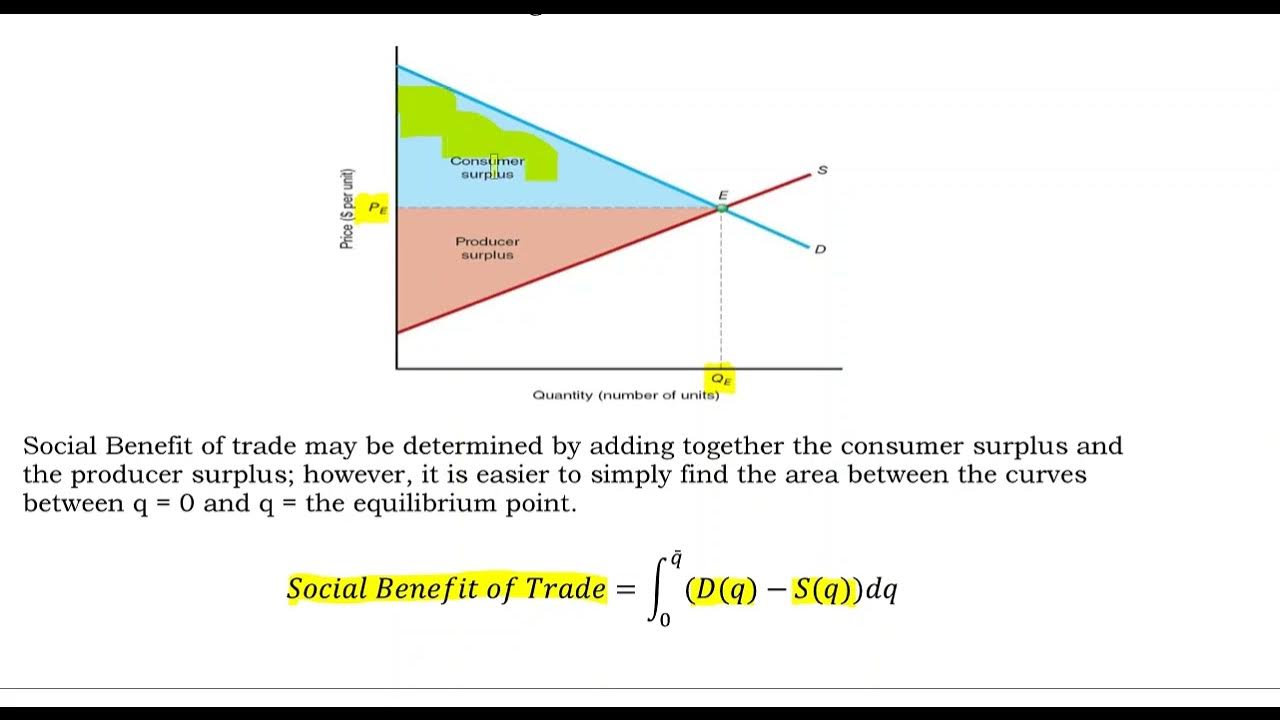
- 💹 The market price is determined where supply equals demand, and this price dictates the quantity produced and the level of producer surplus.
- 🤑 Producer surplus is the difference between what producers receive for their goods and their opportunity cost of production, representing the excess value they gain.
- 📉 For the first 3999 pounds of berries, producers receive more than their opportunity cost, indicating a producer surplus.
- 📏 The script assumes a linear supply curve for simplicity, which allows for the calculation of producer surplus as the area of a triangle.
- 🔢 The formula for calculating the producer surplus from a linear supply curve is given as half the base times the height of the triangle formed by the price difference and quantity.
- 🏦 The example calculates a producer surplus of $6,000 per week, demonstrating how much value producers gain above their opportunity cost in the given scenario.
- 📝 The transcript provides a clear explanation of economic concepts using a relatable example, making the abstract ideas of supply, opportunity cost, and producer surplus more tangible.
Q & A
What is the producer surplus in the context of the script?
-Producer surplus is the difference between the market price at which goods are sold and the minimum price producers are willing to accept to produce those goods. It represents the excess value that producers receive above their opportunity cost.
How is the supply curve related to the opportunity cost for producers?
-The supply curve can be seen as an opportunity cost curve for producers, where each point on the curve represents the minimum price producers need to be paid to supply a certain quantity of goods, considering the next best alternative use of their resources.
What does the script imply about the relationship between the quantity produced and the opportunity cost?
-The script suggests that as the quantity produced increases, producers may have to use less suitable resources, which could increase the opportunity cost of production for each additional unit.
Why is the first thousand pounds of berries produced at a lower opportunity cost?
-The first thousand pounds of berries are produced using the most suitable resources, such as the best land, most efficient labor, and proximity to transportation networks, which results in a lower opportunity cost.
How does the producer surplus change as more quantity is demanded?
-As more quantity is demanded, producers may have to use less efficient resources, increasing the opportunity cost. However, if the market price remains the same, the producer surplus may increase because producers are still receiving more than their opportunity cost for the additional quantity.
What is the market price in the script's example?
-In the script's example, the market price is $4 per pound, which is the price where supply equals demand for 4 thousand pounds of berries.
How is the producer surplus calculated in the script?
-The producer surplus is calculated by finding the area of the triangle formed by the difference between the market price and the opportunity cost at the quantity produced. It is the product of the vertical distance (difference in price) and the horizontal distance (quantity), divided by 2.
Outlines
📊 Introduction to Producer Surplus and Supply Curve
This paragraph introduces the concept of producer surplus, which is the difference between the market price and the opportunity cost for producers. It uses the analogy of a berry farm to explain the supply curve from the perspective of producers. The opportunity cost is the minimum price producers need to be paid to produce a certain quantity of goods, which is influenced by the resources used and their alternative uses. The explanation covers how the opportunity cost increases as producers use less suitable resources to meet higher production targets.
💰 Calculating Producer Surplus with a Linear Supply Curve
The second paragraph delves into how the supply curve represents the opportunity cost for suppliers and uses a hypothetical market scenario with a linear supply curve to illustrate the calculation of producer surplus. It explains that the market price, where supply equals demand, determines the point of equilibrium. Producer surplus is the area above the supply curve and below the market price, representing the excess value producers receive over their opportunity cost. The paragraph provides a step-by-step calculation of producer surplus using the area of a triangle formula, resulting in a specific monetary value for the surplus per week.
Mindmap
Keywords
💡Demand Curve
💡Consumer Surplus
💡Supply Curve
💡Producer Surplus
💡Opportunity Cost
💡Price Axis
💡Quantity Axis
💡Market Price
💡Linear Supply Curve
💡Area of Triangle
💡Producers' Surplus Calculation
Highlights
Introduction to the concept of producer surplus in relation to the supply curve.
Explanation of how the supply curve represents the minimum price producers need to be compensated to supply a certain quantity.
Illustration of the opportunity cost for producers to produce 1 thousand pounds of berries.
Discussion on the minimum price producers require to be compensated for their resources, such as land and labor.
Clarification that the opportunity cost varies with the quantity produced, increasing as less suitable resources are used.
Description of the incremental opportunity cost for producing additional quantities of berries.
Analysis of the supply curve as a reflection of the opportunity costs faced by producers.
Introduction of the market
Transcripts


5.0 / 5 (0 votes)
Thanks for rating: