What is Consumers Surplus and Producer Surplus?
TLDRIn this educational transcript, Professor Monte explains the concepts of consumer surplus and producer surplus using supply and demand curves. He describes the supply curve as being controlled by producers and the demand curve by consumers. The equilibrium point, where supply meets demand, is established with a given quantity and price. Consumer surplus is the difference between what consumers are willing to pay and what they actually pay, illustrated as a triangle under the demand curve but above the equilibrium price. Producer surplus is the difference between the price at which producers are willing to sell and the equilibrium price, depicted as the area above the supply curve but below the equilibrium price. The formulas for calculating these surpluses are also discussed, highlighting the additional amount consumers are willing to spend without obligation and the additional profit for producers. The transcript concludes with an invitation to watch another video for a practical problem-solving example.
Takeaways
- 📈 **Supply and Demand Curves**: The video starts with an explanation of supply and demand curves, which are fundamental to understanding consumer and producer surplus.
- 💡 **Equilibrium Point**: The equilibrium price and quantity are determined where the supply and demand curves intersect, representing the market equilibrium.
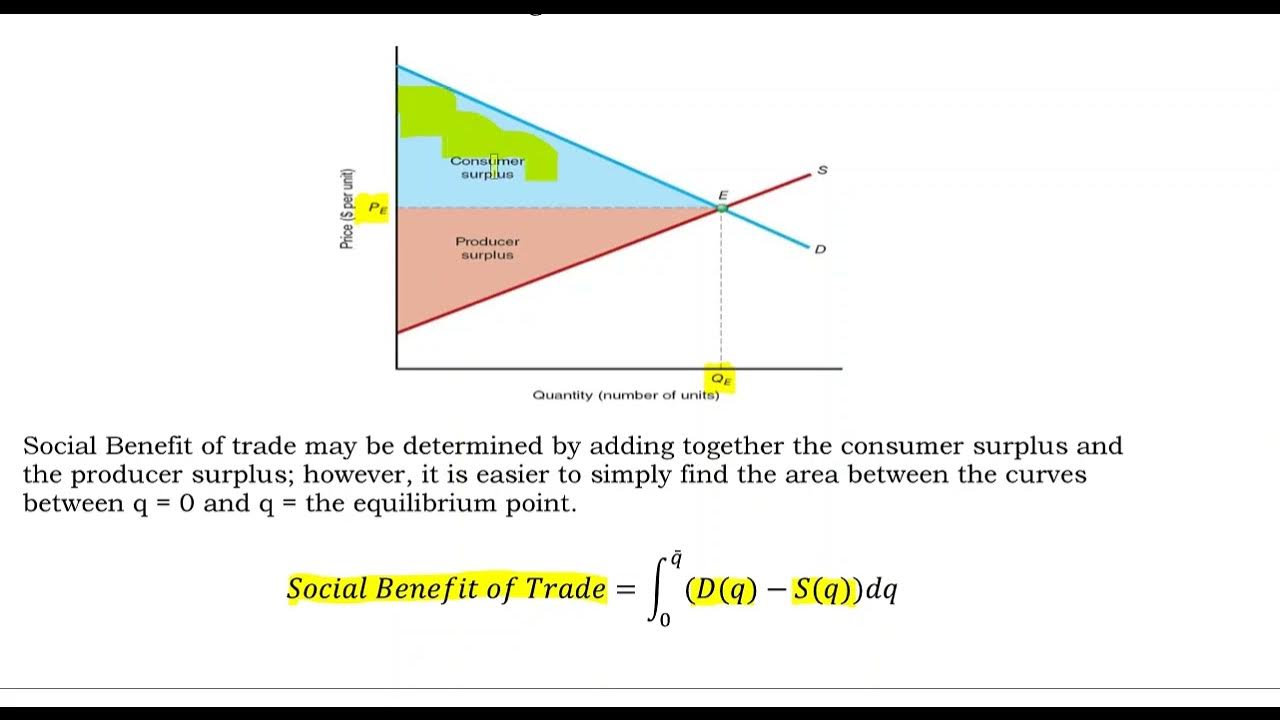
- 💰 **Consumer Surplus**: It is the difference between what consumers are willing to pay and what they actually pay, which is the area under the demand curve but above the market price.
- 📉 **Demand Curve**: The demand curve represents the maximum amount consumers are willing to pay for each unit, with the curve being negatively sloped.
- 📈 **Supply Curve**: The supply curve shows the minimum amount producers are willing to accept for each unit, typically with a positively sloped curve.
- 🔍 **Calculating Consumer Surplus**: The formula for consumer surplus involves subtracting the area representing revenue (price times quantity) from the area under the demand curve.
- 🎓 **Consumer Willingness to Pay**: Consumers may be willing to pay more than the equilibrium price for a unit, but due to market pricing, they pay less, resulting in consumer surplus.
- 📊 **Producer Surplus**: It is the difference between the price at which producers are willing to sell and the equilibrium price, which is the area above the supply curve but below the market price.
- 💼 **Revenue and Profit**: Producer surplus can also be viewed as the additional profit producers make because they sell at a price higher than their minimum willingness to accept.
- 🤝 **Win-Win Situation**: Both consumers and producers benefit in a market equilibrium, as consumers pay less than their maximum willingness to pay, and producers receive more than their minimum acceptable price.
- 📚 **Further Learning**: The video encourages viewers to watch another video for a worked example of calculating consumer and producer surplus.
Q & A
What is the basic concept of consumer surplus?
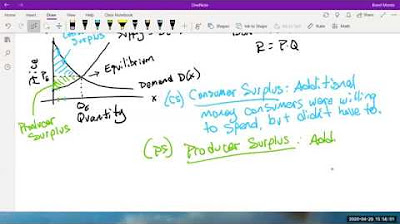
-Consumer surplus is the additional amount that consumers are willing to spend on a product or service but do not have to because of the market price being lower than what they are willing to pay.
How is the consumer surplus calculated?
-Consumer surplus is calculated by finding the area under the demand curve from zero to the quantity at equilibrium (q), and then subtracting the rectangle formed by price times quantity (revenue).
What is the equilibrium point in the context of supply and demand?
-The equilibrium point is where the supply and demand curves intersect, indicating the quantity and price at which the market is in balance, with the quantity supplied equaling the quantity demanded.
How does the supply curve represent the producer's perspective?
-The supply curve represents the producer's perspective by showing the price that the producer is willing to accept for each quantity of goods or services provided. It is influenced by the costs and profit motives of the producer.
What is the formula for calculating the revenue in the context of supply and demand?
-The revenue is calculated as the price of the good or service multiplied by the quantity sold, which is the price at equilibrium times the quantity at equilibrium.
What is producer surplus and how is it determined?
-Producer surplus is the additional profit that producers make because they are able to sell their goods or services for more than they are willing to accept. It is determined by the difference between the revenue (price times quantity) and the area under the supply curve up to the quantity at equilibrium.
How does the demand curve represent the consumer's perspective?
-The demand curve represents the consumer's perspective by showing the maximum price that consumers are willing to pay for each quantity of goods or services. It reflects the consumers' willingness to pay and their demand for the product.
What is the significance of the equilibrium price?
-The equilibrium price is significant because it is the price at which the quantity supplied by producers equals the quantity demanded by consumers, indicating a market balance.
Why is the area above the supply curve considered producer surplus?
-The area above the supply curve is considered producer surplus because it represents the additional revenue that producers earn by selling their goods at the equilibrium price, which is higher than the minimum price they are willing to accept.
What does the area under the demand curve represent?
-The area under the demand curve represents the total willingness to pay of consumers for the quantity demanded at each price level, up to the equilibrium point.
How does the concept of consumer surplus relate to the idea of consumer welfare?
-Consumer surplus is directly related to consumer welfare as it measures the difference between what consumers are willing to pay and what they actually pay, indicating the net benefit or satisfaction gained by consumers from participating in the market.
What is the implication of a high consumer surplus in a market?
-A high consumer surplus implies that consumers are getting a significant amount of value from the market, as they are paying less than what they are willing to pay. This can indicate a competitive market where consumers have a good deal of purchasing power.
Outlines
📈 Introduction to Consumer and Producer Surplus
Professor Monte introduces the concepts of consumer surplus and producer surplus by starting with the supply and demand curves. He uses a supply equation (S(x) = x + 5) and a demand equation (D(x) = -2x + 50) to illustrate these concepts. The equilibrium point is calculated to be at a price of $20 for 15 units. Consumer surplus is explained as the difference between what consumers are willing to pay and what they actually pay, which is the area under the demand curve up to the equilibrium quantity minus the total revenue (price times quantity). This surplus is visualized as a triangle on the graph.
💼 Calculating Consumer and Producer Surplus
The video continues with the formula and method to calculate consumer surplus, which is the area under the demand curve from zero to the equilibrium quantity minus the revenue (price times quantity). The professor then transitions to producer surplus, which is the amount producers gain over and above their willingness to supply, visualized as the area above the supply curve. Producer surplus is calculated as the total revenue minus the area under the supply curve up to the equilibrium quantity. The professor suggests that this surplus represents additional profit for the producer, assuming there's some profit included in the supply curve.
📚 Next Steps: Solving the Problem
The final paragraph is a brief note indicating that the professor will demonstrate how to solve the problem in another video. It serves as a teaser and an encouragement for viewers to continue watching the series to understand the application of the concepts discussed.
Mindmap
Keywords
💡Consumer Surplus
💡Producer Surplus
💡Equilibrium
💡Demand Curve
💡Supply Curve
💡Price
💡Quantity
💡Revenue
💡Area under the Curve
💡Market Price
Highlights
Professor Monte introduces the concepts of consumer surplus and producer surplus using supply and demand curves.
Supply is controlled by the producer and is represented by the equation S(x) = x + 5.
Demand is controlled by the consumers and is represented by the equation D(x) = -2x + 50.
The equilibrium point is where the quantity and price are in balance, set at 15 units and $20 each.
Consumer surplus is the difference between what consumers are willing to pay and what they actually pay.
An example given is a consumer willing to spend $48 on one unit but only pays $20 at equilibrium.
Consumer surplus is the triangular area under the demand curve from 0 to the equilibrium quantity.
The formula for calculating consumer surplus is the integral under the demand curve minus the revenue (price times quantity).
Producer surplus is the difference between the price at which producers are willing to sell and the equilibrium price.
An example given is a producer willing to sell one unit for $6 but sells it for $20 at equilibrium.
Producer surplus is the area above the supply curve and represents additional profit for the producer.
The formula for calculating producer surplus is total revenue minus the area under the supply curve up to the equilibrium quantity.
Consumer surplus and producer surplus together represent the total welfare created by a market transaction.
Both consumers and producers benefit in a win-win situation where the market reaches equilibrium.
The concept of surplus is important for understanding the efficiency and fairness of market outcomes.
Professor Monte encourages viewers to watch another video for a practical example of calculating surplus.
The video provides a comprehensive understanding of surplus in the context of economic equilibrium.
The use of simple mathematical models helps to clarify complex economic principles.
Transcripts


5.0 / 5 (0 votes)
Thanks for rating: