Consumers' Surplus Producers' Surplus from given Demand and Supply functions
TLDRThis educational video script teaches viewers how to calculate producer and consumer surplus in a market with perfect competition. By using a given quadratic demand function and a linear supply function, the script guides through finding the equilibrium price and quantity. It then explains how to determine consumer surplus as the area between the demand curve and the equilibrium price, and producer surplus as the difference between total revenue and cost, both graphically and mathematically. The script concludes with an integral approach to calculate these surpluses, emphasizing the importance of understanding economic concepts.
Takeaways
- 📚 The video is a tutorial on calculating producer surplus and consumer surplus from a given example.
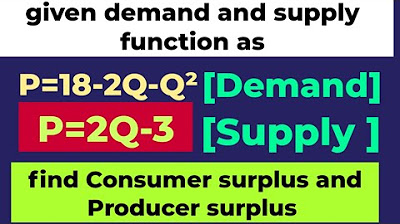
- 📉 The demand function is given as \( p_d = 27 - q^2 \), where \( p_d \) is price and \( q \) is quantity.
- 📈 The supply function is given as \( p_s = 2q + 3 \), representing the quantity supplied at a given price.
- ⚖️ The concept of equilibrium is introduced, where demand equals supply in a perfect competition market.
- 🔍 The equilibrium quantity is calculated by setting the demand and supply functions equal to each other and solving for \( q \).
- 🔢 The equilibrium quantity is found to be 4 units, after discarding the negative value as quantity cannot be negative.
- 💰 The equilibrium price is calculated by substituting the equilibrium quantity into the supply function, resulting in a price of 11.
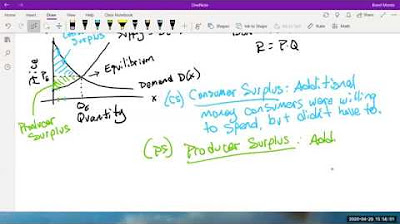
- 🛒 Consumer surplus is defined as the difference between what consumers are willing to pay and what they actually pay, represented graphically as the area below the demand curve and above the equilibrium price.
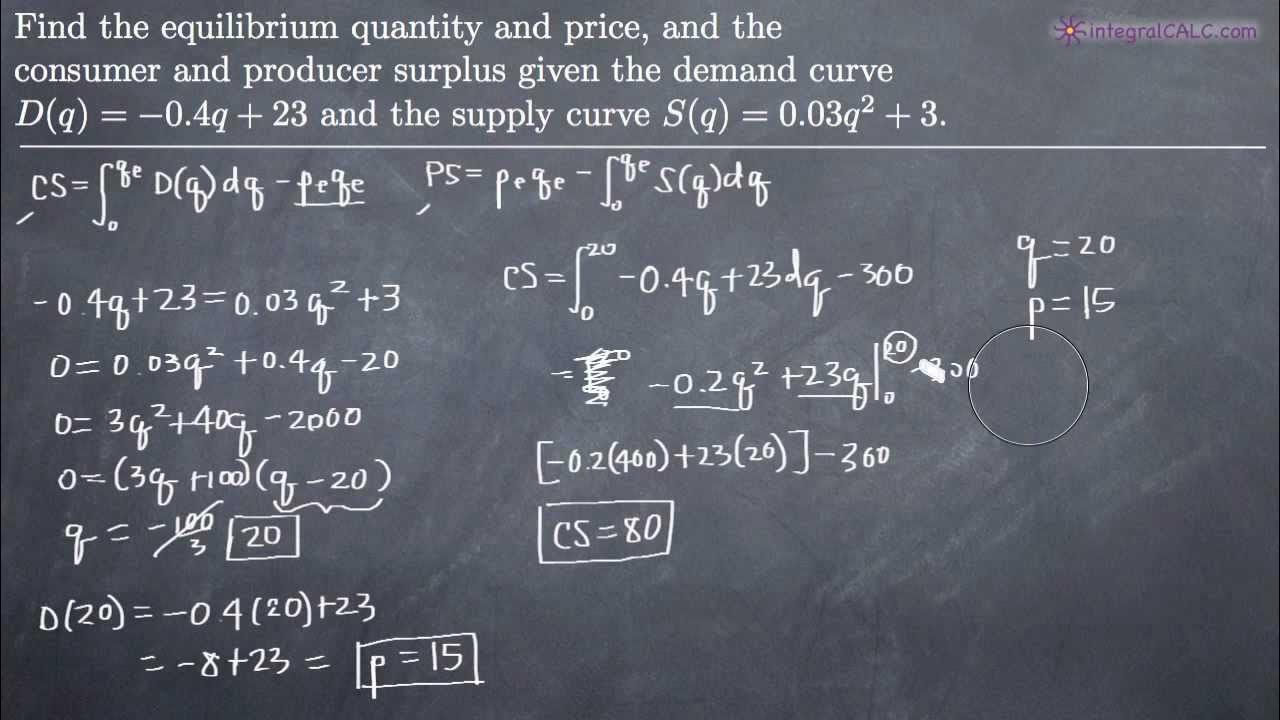
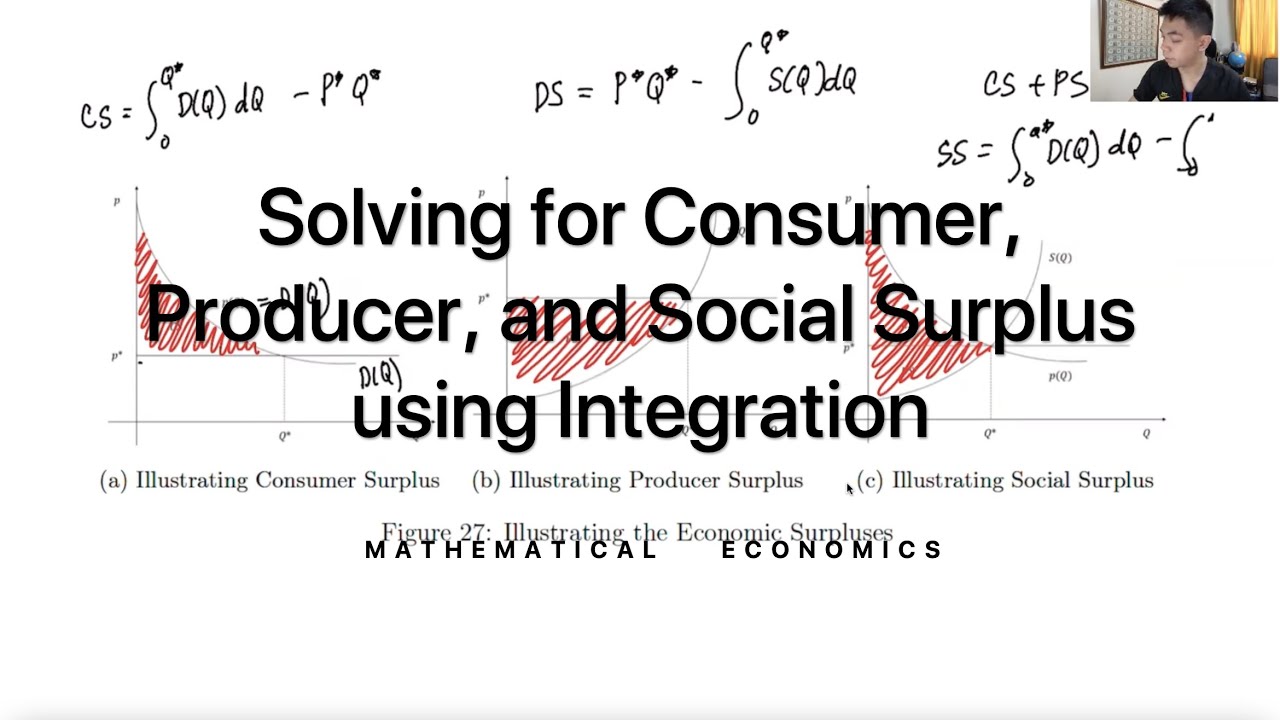
- 📊 Consumer surplus is calculated using the definite integral of the demand function from 0 to the equilibrium quantity, minus the total expenditure at equilibrium.
- 🏭 Producer surplus is the difference between the market price and the price a producer is willing to accept, shown graphically as the area below the supply curve and above the equilibrium price.
- 📘 Producer surplus is calculated by taking the integral of the supply function from 0 to the equilibrium quantity and subtracting the total cost from the total revenue.
- 📈 The final calculated values for consumer surplus and producer surplus are 42.67 and 16, respectively.
Q & A
What is the given demand function in the script?
-The given demand function is pd = 27 - q^2, where pd is the price and q is the quantity demanded.
What is the supply function provided in the script?
-The supply function is ps = 2q + 3, where ps is the price supplied and q is the quantity supplied.
What is the condition for equilibrium in the context of this script?
-At equilibrium, the demand function is equal to the supply function, meaning the quantity demanded is equal to the quantity supplied.
How is the equilibrium quantity found in the script?
-The equilibrium quantity is found by setting the demand function equal to the supply function and solving for q, which results in q = 4 after discarding the negative value.
What is the equilibrium price calculated in the script?
-The equilibrium price is found by substituting the equilibrium quantity (q = 4) into the supply function, resulting in a price of 11.
What is consumer surplus and how is it represented graphically?
-Consumer surplus is the difference between what consumers are willing to pay and what they actually pay. Graphically, it is represented as the area below the demand curve and above the equilibrium price.
How is the consumer surplus calculated in the script?
-Consumer surplus is calculated by integrating the demand function from 0 to the equilibrium quantity and subtracting the total expenditure (price times quantity).
What is producer surplus and how is it represented graphically?
-Producer surplus is the difference between the market price and the minimum price a producer is willing to accept. Graphically, it is the area below the equilibrium price and above the supply curve.
How is the producer surplus calculated in the script?
-Producer surplus is calculated by subtracting the total cost (integrated supply function from 0 to the equilibrium quantity) from the total revenue (price times quantity).
What is the final calculated consumer surplus in the script?
-The final calculated consumer surplus is approximately 42.67.
What is the final calculated producer surplus in the script?
-The final calculated producer surplus is 16.
Outlines
📚 Introduction to Calculating Producer and Consumer Surplus
This paragraph introduces the topic of the video, which is to teach viewers how to calculate producer and consumer surplus using a given demand function (pd = 27 - q^2) and supply function (ps = 2q + 3) under perfect competition. The equilibrium is established where demand equals supply, leading to the calculation of equilibrium price and quantity. The paragraph sets the stage for further explanation of consumer and producer surplus concepts.
🔍 Solving for Equilibrium and Consumer Surplus
The script details the process of finding the equilibrium quantity by setting the demand and supply functions equal to each other and solving for 'q'. It dismisses the negative solution as quantities cannot be negative. The equilibrium price is then found by substituting the equilibrium quantity into the supply function. The concept of consumer surplus is introduced as the difference between what consumers are willing to pay and what they actually pay, represented graphically as the area below the demand curve and above the equilibrium price. The calculation of consumer surplus is explained through integration of the demand function from zero to the equilibrium quantity, minus the total expenditure at the equilibrium price.
📈 Calculating the Area of Consumer Surplus Graphically
This paragraph delves into the graphical representation of consumer surplus as the area under the demand curve and above the equilibrium price. It explains the calculation of this area through integration of the demand function from zero to the equilibrium quantity and subtracting the total expenditure (price multiplied by quantity). The paragraph provides a step-by-step guide to evaluating the integral and subtracting the expenditure to arrive at the numerical value of consumer surplus.
💼 Determining Producer Surplus and Wrapping Up
The final paragraph explains the concept of producer surplus as the difference between the market price and the price a producer is willing to accept, represented as the area below the equilibrium price and above the supply curve. It describes the calculation of producer surplus through integration of the supply function and subtracting the total cost from total revenue. The paragraph concludes by summarizing the process of finding both consumer and producer surplus, emphasizing the importance of understanding the graphical representation and mathematical calculation involved. It also includes a personal note from the video creator about the motivation behind creating educational content.
Mindmap
Keywords
💡Consumer Surplus
💡Producer Surplus
💡Equilibrium
💡Demand Function
💡Supply Function
💡Perfect Competition
💡Quadratic Function
💡Integral
💡Total Revenue
💡Total Cost
Highlights
Introduction to calculating producer surplus and consumer surplus from an example.
Presentation of the given demand function, pd = 27 - q^2, and supply function, ps = 2q + 3, in a perfect competition scenario.
Explanation of the equilibrium concept where demand equals supply in economic terms.
Solving the equation 27 - q^2 = 2q + 3 to find the equilibrium quantity.
Graphical representation of the demand and supply functions, illustrating the intersection points.
Determination that the equilibrium quantity is 4 units, discarding the negative value due to the impossibility of negative quantity.
Calculation of the equilibrium price by substituting the equilibrium quantity into the supply function.
Definition and explanation of consumer surplus as the difference between what consumers are willing to pay and what they actually pay.
Graphical depiction of consumer surplus as the area below the demand curve and above the equilibrium price.
Calculation method for consumer surplus using definite integrals and total expenditure.
Mathematical computation of consumer surplus resulting in a value of 42.67.
Introduction to producer surplus as the difference between the market price and the price a producer is willing to accept.
Graphical representation of producer surplus as the area below the equilibrium price and above the supply curve.
Calculation of producer surplus using total revenue minus total cost, including integrals of the supply function.
Result of producer surplus calculation, yielding a value of 16.
Emphasis on the importance of understanding the concepts of consumer and producer surplus in economic analysis.
Acknowledgment of the video's educational purpose and the creator's intent to share knowledge without commercialization.
Transcripts


5.0 / 5 (0 votes)
Thanks for rating: