Equations of Motion by Graphical Method
TLDRThis educational video class focuses on the graphical method of deriving equations of motion in physics. The instructor clearly explains the three fundamental equations, using symbols for initial velocity (U), final velocity (V), time (t), displacement (s), and acceleration (a). The class involves interactive learning with the use of graph paper to visualize concepts, emphasizing the importance of understanding graphs to calculate values, slopes, and areas for deriving motion equations. The session also includes practical problem-solving using a velocity-time graph to find maximum velocity, acceleration, and total distance traveled, reinforcing the concepts taught.
Takeaways
- 📚 The class focuses on deriving equations of motion using the graphical method, ensuring a clear understanding of the concepts.
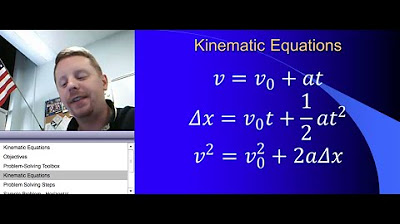
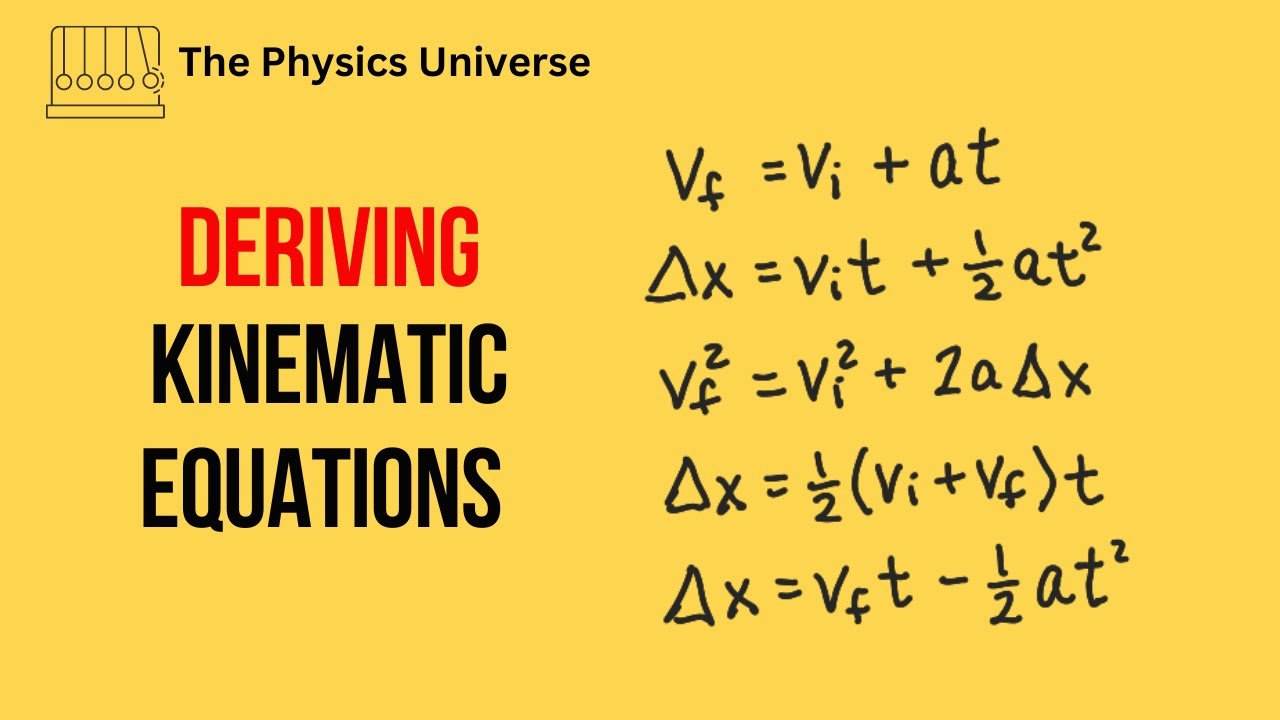
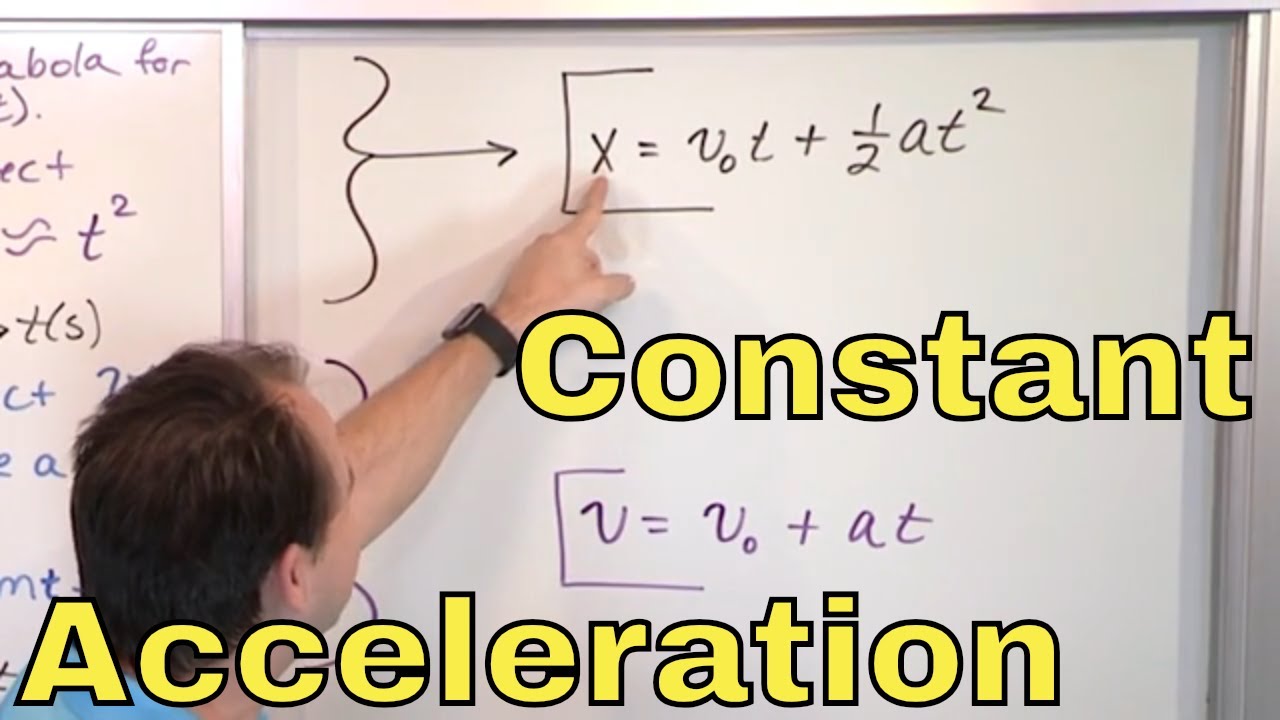
- 🔍 The three fundamental equations of motion are v = u + at, s = ut + 0.5at², and v² = u² + 2as, which are essential for understanding motion dynamics.
- 📉 The velocity-time graph is central to the graphical method, where the slope represents acceleration, and the area under the curve represents displacement.
- ✍️ Students are encouraged to actively engage with the material by writing down equations and sketching graphs to enhance memorization and comprehension.
- 🕒 Time (t) is a key variable in these equations, measured in seconds, and is represented on the x-axis of the velocity-time graph.
- 🏎️ Initial velocity (u) and final velocity (v) are measured in meters per second and are crucial for solving motion problems, with initial velocity read at time zero on the graph.
- ⏱️ Acceleration (a) is the rate of change of velocity with time and can be determined from the slope of the velocity-time graph, with units of meters per second squared.
- 📏 Displacement (s), not to be confused with speed, is the distance covered by an object in a straight line, measured in meters.
- 📐 The graphical method involves reading values directly from the graph, calculating the slope, and determining the area under the graph to derive motion equations.
- 📈 The area under the velocity-time graph can be found by approximating the shape under the curve, such as breaking it into a rectangle and a triangle or using the trapezium area formula.
- 📝 The class also covers practical applications of the graphical method, such as finding maximum velocity, acceleration during specific time intervals, and total distance traveled.
Q & A
What are the three fundamental equations of motion discussed in the class?
-The three fundamental equations of motion discussed are: 1) v = u + at, 2) s = ut + 0.5at^2, and 3) v^2 = u^2 + 2as.
What does the symbol 'U' represent in the equations of motion?
-In the equations of motion, 'U' represents the initial velocity of an object, measured in meters per second (m/s).
What is the physical meaning of 'V' in the context of the equations of motion?
-'V' stands for the final velocity of an object, which is the velocity measured at the end of an experiment or observation, also measured in meters per second (m/s).
What does 'T' denote in the equations of motion, and what is its SI unit?
-'T' denotes time in the equations of motion, and its SI unit is seconds.
What is the difference between displacement 'S' and speed in physics?
-Displacement 'S' refers to the change in position of an object and is measured in meters, considering direction, while speed is the rate at which an object is moving without regard to direction.
What is acceleration 'a', and what are its possible values?
-Acceleration 'a' is the rate of change of velocity. It can be positive (increasing speed) or negative (deceleration or slowing down), and its SI unit is meters per second squared (m/s^2).
How can the slope of a velocity-time graph be used to determine acceleration?
-The slope of a velocity-time graph represents the change in velocity over time, which is the definition of acceleration. The slope is calculated as the change in velocity (ΔV) divided by the change in time (ΔT).
What does the area under a velocity-time graph represent?
-The area under a velocity-time graph represents the displacement or distance traveled by an object, as it is the product of velocity and time.
How can the graphical method help in deriving the equations of motion?
-The graphical method allows for the visual representation and understanding of the relationships between velocity, time, acceleration, and displacement. By analyzing the slope and area under the graph, one can derive the equations of motion.
What is the significance of uniform acceleration in deriving the equations of motion?
-Uniform acceleration simplifies the equations of motion, as the acceleration remains constant, making it easier to predict future motion and derive precise relationships between velocity, time, and displacement.
Outlines
📚 Introduction to Graphical Method for Equations of Motion
This paragraph introduces the class on equations of motion using the graphical method. The instructor emphasizes the importance of this class and encourages students to check out other courses available on their website, covering subjects like physics, chemistry, biology, and math for different grade levels. The instructor also promotes courses for the Cambridge IGCSE board and coding courses in Python and Java. They remind students to subscribe to their YouTube channel and follow them on social media platforms for continuous learning opportunities.
🔍 Understanding the Velocity-Time Graph and Its Components
The paragraph delves into the specifics of a velocity-time graph, explaining how to identify it by the axes labels. It discusses the increase in velocity over time as depicted by the graph, which indicates accelerated motion. The instructor explains the three key things that can be derived from a graph: reading values, calculating the slope, and determining the area under the graph. The paragraph also covers how to read initial and final velocities from the graph and how the slope of the graph represents acceleration.
📈 Deriving the First Equation of Motion Graphically
This section focuses on deriving the first equation of motion, V = U + at, using a velocity-time graph. The instructor explains the concept of acceleration as the slope of the graph and provides a step-by-step guide on how to calculate it using the change in velocity over time. The paragraph concludes with the successful derivation of the first equation by demonstrating that the slope (acceleration) multiplied by time (t) plus the initial velocity (U) equals the final velocity (V).
📐 Breaking Down the Area Under the Velocity-Time Graph for Displacement
The paragraph explains how to calculate displacement from a velocity-time graph by considering the area under the graph. It suggests breaking the area into a rectangle and a triangle for easier calculation. The instructor provides formulas for the areas of these shapes and shows how their sum equates to displacement. However, it is noted that the direct formula for the area of a trapezium is not used here, and the reason for this choice is hinted to be explained later.
📉 Deriving the Second Equation of Motion Using Graphical Method
The instructor continues with the graphical method to derive the second equation of motion, s = ut + (1/2)at^2. The paragraph describes how to use the area under the graph, now considering it as a trapezium, to find displacement. It explains the formula for the area of a trapezium and how it can be used to derive the equation. The first equation of motion is then used to substitute and simplify the expression to match the desired equation.
🚀 Deriving the Third Equation of Motion with Graphical Analysis
The final part of the script focuses on deriving the third equation of motion, V^2 = U^2 + 2as, using the graphical method. The instructor explains how to find the area under the graph as a trapezium and how this area represents displacement. The paragraph walks through the algebraic manipulation of the area formula to eliminate time and express the equation solely in terms of initial velocity, final velocity, acceleration, and displacement, successfully matching the third equation of motion.
📝 Applying Graphical Method to Solve Motion Problems
This paragraph applies the concepts learned to solve specific problems related to motion, using a given velocity-time graph. It demonstrates how to find maximum velocity, acceleration during different time intervals, and total distance traveled within a certain time frame. The instructor guides the students through each step, emphasizing the importance of reading values, calculating slopes, and determining areas from the graph to extract meaningful physical quantities.
🎓 Conclusion and Promotion of Educational Resources
The final paragraph wraps up the class on equations of motion using the graphical method. The instructor expresses hope that the concepts have been clearly understood and encourages students to practice with the graphical method. The paragraph also serves as a reminder to explore other courses offered by the academy, including subjects for various grade levels and programming languages. The importance of following their social media channels for continuous engagement and learning is reiterated.
Mindmap
Keywords
💡Equations of Motion
💡Graphical Method
💡Velocity-Time Graph
💡Acceleration
💡Displacement
💡Initial Velocity (U)
💡Final Velocity (V)
💡Time (t)
💡Slope
💡Area Under the Graph
Highlights
Introduction to the class focusing on equations of motion using the graphical method.
Promotion of other courses available on the website for different subjects and classes.
Explanation of the three fundamental equations of motion.
Clarification of the symbols used in the equations of motion: U (initial velocity), V (final velocity), t (time), s (displacement), and a (acceleration).
Emphasis on the importance of understanding the direction of acceleration as either positive or negative.
Advice on learning the equations of motion by writing them down, not just passively reading.
Introduction to the velocity-time graph and its components.
Explanation of how to read values, calculate slope, and find the area under a graph to derive physical quantities.
Derivation of the first equation of motion (V = U + at) using the slope of the velocity-time graph.
Graphical derivation of the second equation of motion (s = ut + 0.5at^2) using the area under the graph.
Use of the first derived equation to help derive the second equation of motion.
Derivation of the third equation of motion (V^2 = U^2 + 2as) using the area of a trapezium under the graph.
Explanation of why the area under the graph represents displacement.
Practice questions to apply the understanding of the graphical method for deriving equations of motion.
Solution of a practice question involving finding maximum velocity from a velocity-time graph.
Solution of a practice question involving calculating acceleration between specific time intervals from a graph.
Solution of a practice question involving finding the total distance traveled over a given time period using the area under a graph.
Conclusion and final remarks encouraging students to check out other courses and stay connected with Manocha Academy.
Transcripts
Browse More Related Video
High School Physics: Kinematic Equations

Velocity Time Graphs, Acceleration & Position Time Graphs - Physics
Calculus AB/BC – 8.2 Connecting Position, Velocity, and Acceleration of Functions Using Integrals
Deriving Kinematic Equations (UPDATED) - Kinematics - Physics
01 - Motion with Constant Acceleration in Physics (Constant Acceleration Equations)
How to Cram Kinematics in 1 hour for AP Physics 1
5.0 / 5 (0 votes)
Thanks for rating: