Calculus AB Homework 1.1 Rates of Change
TLDRThis educational video walks viewers through solving a series of physics and math problems. It covers calculating changes in position and average velocity for a bungee jumper, sketching a diver's height over time, and analyzing population growth in Grand Rapids, Michigan. The script uses both graphical estimations and mathematical equations to demonstrate concepts like instantaneous and average velocity, as well as average rate of change, providing a practical approach to these abstract topics.
Takeaways
- 📚 The video is a tutorial on solving Unit 1 homework problems 1 through 3, suggesting viewers may want to have the Unit 1 packet for reference.
- 📉 The first problem involves analyzing a bungee jumper's height over time, using either a graph or an equation, with the initial height at 200 feet and a significant drop to 100 feet by 15 seconds.
- 🔢 For problem 1B, the video calculates the jumper's average velocity over different time intervals, resulting in negative values indicating a descent, with the steepest descent between 0 to 2 seconds at -50 feet per second.
- 🏃♀️ In problem 1C, the video identifies the steepest part of the graph as the time interval with the greatest average velocity, estimated to be between T=1 and T=2 seconds.
- 📈 For problem 1D, the video estimates the instantaneous velocity at T=5 seconds by using a very small time interval, resulting in an approximate velocity of 21.85 feet per second.
- 🧍♂️ Problem 2 involves sketching a graph of a diver's height changes from a springboard to entering a pool, including resting moments and touching the bottom.
- 📊 The average velocity of the diver between specific time intervals in problem 2B is calculated, showing a non-uniform velocity as the diver moves through different phases.
- 🏊♂️ Problem 2C asks to sketch the diver's instantaneous vertical velocity, identifying moments of rest and direction changes in the velocity.
- 📈 Problem 3 discusses population growth in Grand Rapids, Michigan, with data from the US census showing an increase from 1980 to 2000.
- 📊 The average annual population growth of Grand Rapids from 1980 to 2000 is calculated in problem 3B, resulting in approximately 797.85 people per year.
- 📘 Assuming a 4% growth rate per decade, problem 3II uses a formula to model the population function and calculate average rates of change on various intervals, with results indicating slight variations in growth rates.
Q & A
What is the main topic of the video?
-The video is about working through Unit 1 homework problems 1 through 3, which involve analyzing graphs and equations related to a bungee jumper's height over time, a diver's motion, and population growth of Grand Rapids, Michigan.
How is the bungee jumper's height represented in the video?
-The bungee jumper's height is represented by a function f(T) where T is the time in seconds, and the height H is measured in feet.
What is the change in vertical position of the bungee jumper between T equals 0 and T equals 15?
-The change in vertical position is negative 100 feet, which is calculated as f(15) - f(0) where f(15) is approximately 100 feet and f(0) is 200 feet.
How is average velocity calculated in the context of the bungee jumper's motion?
-The average velocity is calculated as the change in position (final position minus initial position) divided by the change in time.
What does the negative velocity indicate for the bungee jumper's motion?
-A negative velocity indicates that the bungee jumper's position is decreasing, meaning she is moving downward.
What is the estimated average velocity of the bungee jumper between T equals 0 and T equals 15?
-The estimated average velocity is negative 23 feet per second, indicating a downward motion.
How does the video determine the time intervals with the greatest average velocity for the bungee jumper?
-The video determines the time intervals with the greatest average velocity by looking at where the graph representing the jumper's height is the steepest, which visually appears to be between T equals 1 and T equals 2.
What is the formula used to model the population growth of Grand Rapids, Michigan?
-The population growth is modeled with the formula P(T) = 1801843 * 1.04^(T/10), where T is the number of years since January 1st, 1980.
How many people did the population of Grand Rapids grow between 1980 and 2000?
-The population of Grand Rapids grew by 15,957 people between 1980 and 2000.
What is the average rate of change of the population per year between 1980 and 2000 for Grand Rapids?
-The average rate of change of the population per year between 1980 and 2000 is approximately 797.85 people.
How does the video estimate the instantaneous velocity of the bungee jumper at T equals five seconds?
-The video estimates the instantaneous velocity by calculating the average velocity over a very small interval around T equals five seconds, using the equation for the jumper's height and choosing a small value for H.
What is the estimated instantaneous velocity of the bungee jumper at T equals five seconds?
-The estimated instantaneous velocity at T equals five seconds is approximately 21.854 feet per second.
Outlines
📚 Bungee Jumper's Height and Velocity Analysis
This paragraph discusses a video tutorial on solving a bungee jumping problem from a unit 1 homework packet. The video covers three questions: calculating the change in the jumper's vertical position between times T=0 and T=15, estimating the jumper's average velocity over different time intervals, and identifying the time intervals with the greatest average velocity. The analysis relies on both graphical estimates and the given equation for the jumper's height over time. The video also touches on the concept of instantaneous velocity at a specific time by using a very small time interval.
🏊♂️ Diver's Motion and Velocity Graphs
In this section, the script describes the process of sketching a graph to represent a diver's height changes from leaving a springboard to entering a pool. Key moments such as the diver's takeoff, reaching maximum height, entering the water, and touching the pool bottom are highlighted. The paragraph also covers the calculation of the diver's average velocity during different intervals and the concept of instantaneous velocity, which is represented by the graph's steepness indicating speed and direction of motion.
📊 Population Growth of Grand Rapids Over Time
This paragraph presents an analysis of the population growth in Grand Rapids, Michigan, using data from the US census. It details the population figures for the years 1980, 1990, and 2000, and calculates the total growth and the average annual growth over the 20-year period. The script also explains the concept of average rate of change in population and applies it to different intervals to determine how the growth rate varied. Additionally, it introduces a population growth model formula to estimate the average rate of change on specific intervals and attempts to determine the instantaneous rate of change on a particular date.
📈 Applying Mathematical Concepts to Real-World Data
The final paragraph extends the mathematical concepts of average and instantaneous rates of change to analyze population data. It uses the previously introduced growth model to calculate the average rate of change on various intervals, illustrating how to apply these concepts to predict population changes. The paragraph also addresses the question of how fast the population was changing on a specific date by approximating the instantaneous rate of change, which provides insight into the population's growth momentum at that moment.
Mindmap
Keywords
💡Bungee Jumper
💡Average Velocity
💡Instantaneous Velocity
💡Graph
💡Change in Position
💡Diver
💡Population Growth
💡Average Rate of Change
💡Instantaneous Rate of Change
💡Census Data
💡Exponential Growth
Highlights
Introduction to solving Unit 1 homework problems 1 through 3 with an optional packet download.
Explanation of how to use a graph to determine the change in vertical position of a bungee jumper between two times.
Calculation of the bungee jumper's change in position from T=0 to T=15, resulting in a 100 feet descent.
Method to estimate the jumper's average velocity on different time intervals using the change in height over time.
Estimation of the bungee jumper's average velocity on the interval from 0 to 15 seconds as -23 feet per second.
Graphical approach to determine the average velocity during various time intervals, including 0 to 2 seconds and 1 to 6 seconds.
Identification of the time interval with the greatest average velocity for the bungee jumper, estimated to be between T=1 and T=2.
Technique to estimate the instantaneous velocity at a specific time using a very small time interval around that point.
Calculation of the instantaneous velocity at T=5 seconds, resulting in an approximate velocity of 21.854 feet per second.
Discussion on the difference between average and instantaneous velocities and the interpretation of negative velocity.
Sketching a graph to represent a diver's height changes from a springboard to entering a swimming pool.
Calculation of the average velocity of the diver between specific times, including the interval from T=2.45 to T=7.
Analysis of the diver's instantaneous vertical velocity with a sketch representing moments of rest and changes in direction.
Population growth analysis of Grand Rapids, Michigan from 1980 to 2000 using US census data.
Computation of the average annual population growth of Grand Rapids between 1980 and 2000, approximately 798 people per year.
Explanation of how to calculate the average rate of change of population using a given formula and specific time intervals.
Estimation of the instantaneous rate of population change on January 1st, 1985 using a small time interval approximation.
Projection of the expected additional population for the following year based on the instantaneous rate of change.
Transcripts
Browse More Related Video
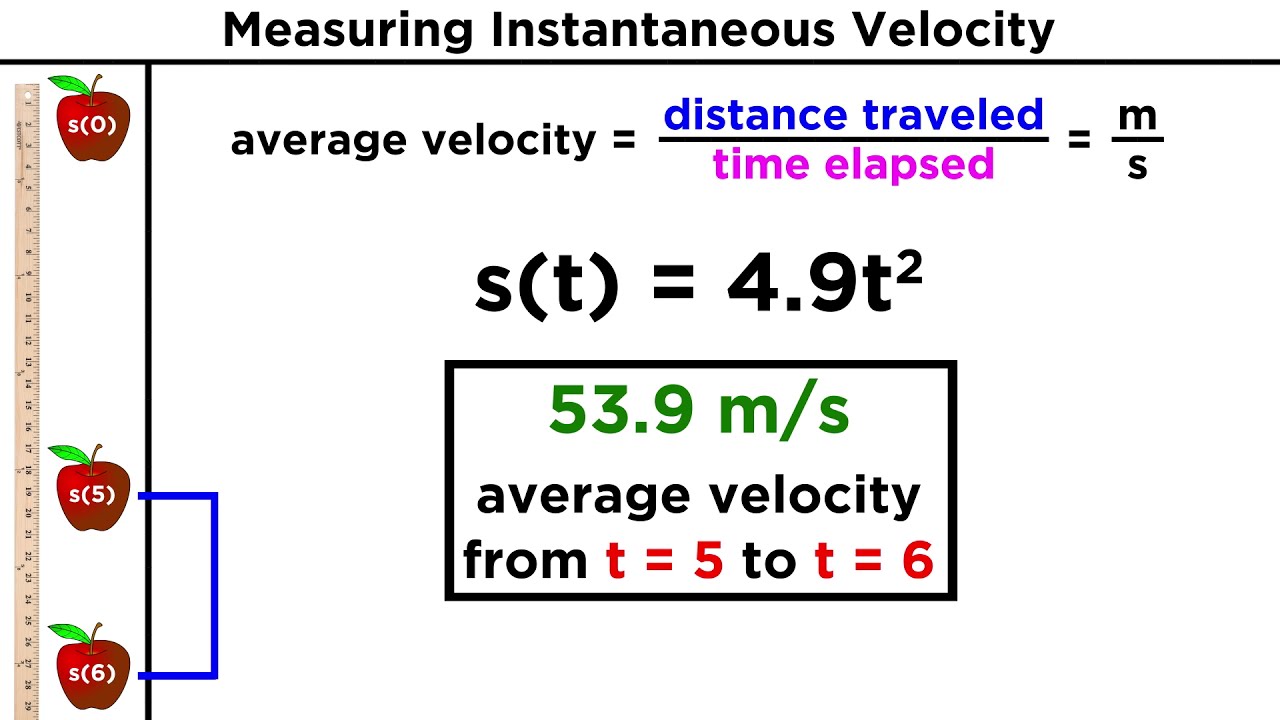
Average/Instantaneous Rates of Changes
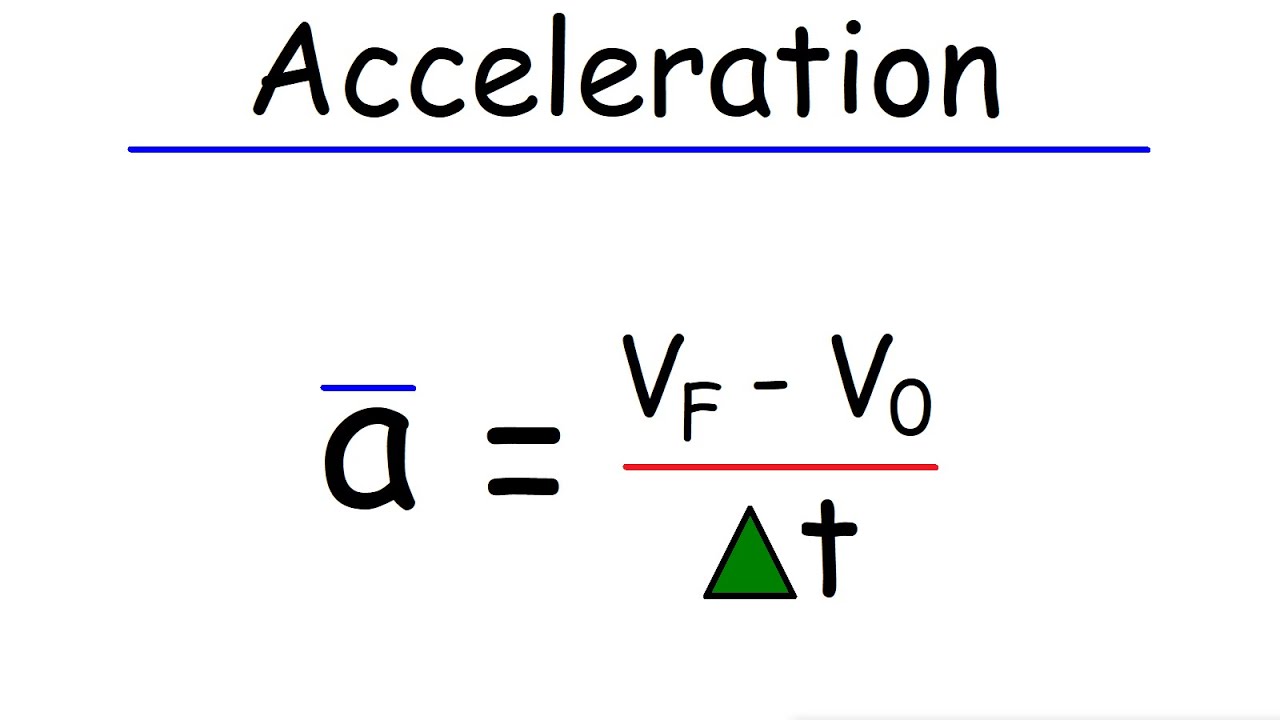
Average Acceleration and Instantaneous Acceleration
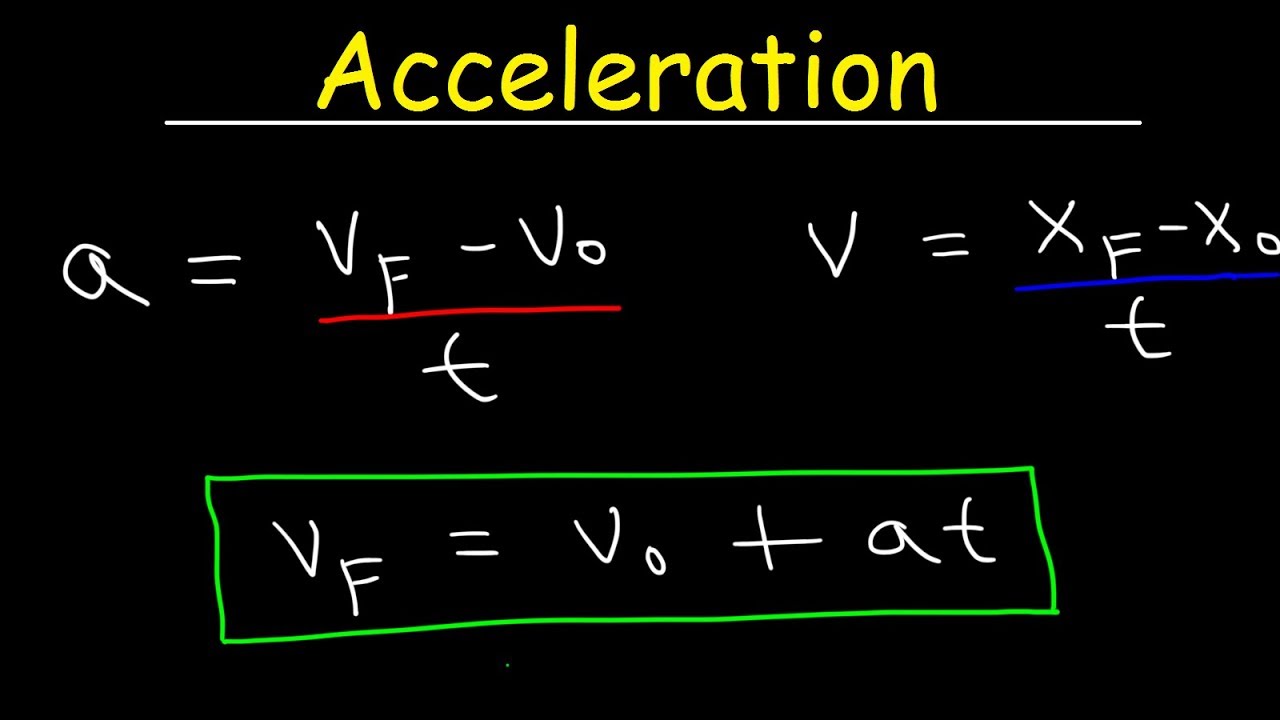
Physics - Acceleration & Velocity - One Dimensional Motion

Calculus AB Homework 5.5: Particle Motion Practice

8.01x - Lect 2 - 1D Kinematics - Speed, Velocity, Acceleration
Understanding Differentiation Part 2: Rates of Change
5.0 / 5 (0 votes)
Thanks for rating: