Functions and Graphs | Precalculus
TLDRThis video script offers a comprehensive review of functions and their graphical representations through a series of problems. It begins with evaluating a quadratic function at a specific point, followed by solving for x when a function equals a constant. The script then delves into the vertical line test to identify functions from given graphs, calculates the value of a function from a graph, and discusses intervals of increase, decrease, and constancy. It also identifies the location and value of relative extrema, evaluates a piecewise function, and determines the domain and range of a graph. The script concludes with a method to find the difference quotient of a function, illustrating the process with a square root function. The video is designed to be interactive, encouraging viewers to pause and solve problems independently for a deeper understanding.
Takeaways
- 📚 The video is a multiple-choice review focusing on functions and their graphs, starting with evaluating a quadratic function at a specific point.
- 🔍 To evaluate a function at a specific point, replace the variable with the given value and perform the calculation.
- 🧩 When solving for x where f(x) equals a constant, manipulate the equation to isolate x, considering the absolute value and solving for two possible x values.
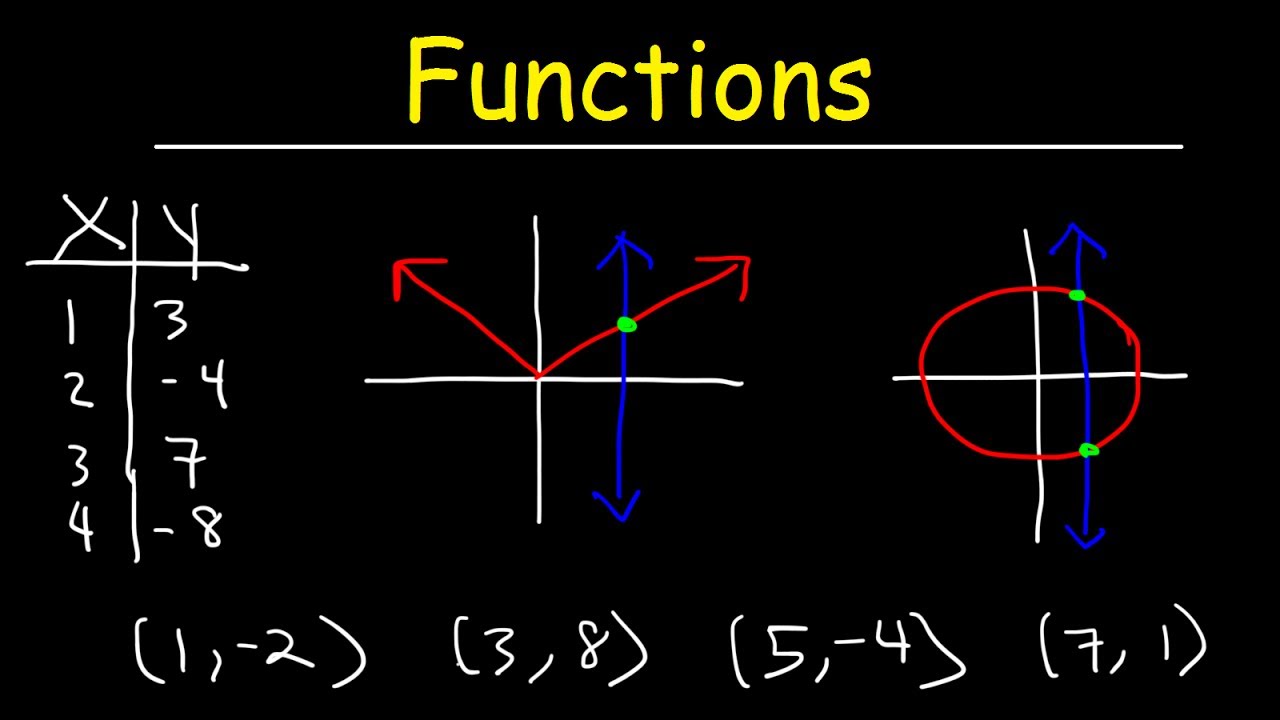
- 📉 The vertical line test is used to determine if a graph represents a function; a graph passes the test if no vertical line intersects it more than once.
- 📈 The value of a function at a specific x can be found by looking at the corresponding y value on the graph.
- 📊 To determine intervals of increase, decrease, and constancy for a function, analyze the graph's behavior and express these intervals using union notation.
- 🏔 Identifying the location of a relative maximum or minimum on a graph involves locating the x-coordinate where the function reaches its peak or valley.
- 📐 For piecewise functions, select the appropriate function segment based on the value of x and then evaluate it.
- 📏 The domain of a graph is expressed using interval notation, including all possible x-values, while the range includes all possible y-values.
- 🔑 The difference quotient is calculated using the formula (f(x+h) - f(x))/h, and simplification often involves multiplying by the conjugate to eliminate the square roots.
Q & A
What is the value of f(3) for the function f(x) = x^2 - 5x + 7?
-To find f(3), substitute x with 3 in the function: f(3) = 3^2 - 5*3 + 7 = 9 - 15 + 7 = 1. So, f(3) equals 1, which corresponds to answer choice C.
If f(x) = 10, what is the possible value of x for the given quadratic function?
-To solve for x when f(x) = 10, set the function equal to 10 and solve the resulting quadratic equation. After adding 8 to both sides and dividing by 2, we get x - 5 = ±9, which gives x = 14 or x = -4. Since -4 is listed, the correct answer is B.
How can you determine if a graph represents a function?
-A graph represents a function if it passes the vertical line test, meaning a vertical line drawn anywhere through the graph will intersect it at no more than one point. Choices A, C, and D fail this test, while choice B passes, indicating it is a function.
What is the value of f(-1) according to the graph provided in the script?
-To find f(-1), locate the point on the graph where x is -1. The corresponding y-value is 2, so f(-1) is equal to 2, which corresponds to answer choice D.
If f(x) = 3, what could be the possible values of x based on the graph?
-When f(x) = 3, we look for the x-values where y equals 3 on the graph. The x-values are -2 and approximately 5, but since -2 is listed in the answer choices, x can be -2.
What are the intervals where the function f(x) = x^2 - 5x + 7 is increasing, decreasing, and constant?
-The function is increasing before x = -2 and from x = 3 to infinity. It is decreasing between x = -2 and x = 3. The function is constant between x = -1 and x = 2.
Where is the relative maximum of f(x) located on the graph?
-The relative maximum, which looks like a hill, is located at x = -2 on the graph, so the correct answer is B.
What is the relative minimum value of f(x) on the graph?
-The relative minimum, which looks like a valley, is located at the y-coordinate of -2 on the graph, so the correct answer is B.
What is the value of f(4) for the piecewise function provided?
-Since 4 is greater than 2, we use the first part of the piecewise function: f(4) = 4^2 + 4 = 16 + 4 = 20. Therefore, the correct answer is D.
How do you determine the domain and range of the graph shown in the script?
-The domain includes all the x-values the graph represents, expressed in interval notation as (-5, -2) U [2, ∞). The range includes all the y-values, expressed as [-5, -3] U [1, ∞).
What is the difference quotient for the function f(x) = √(x + 2)?
-The difference quotient is given by (f(x + h) - f(x))/h. For f(x) = √(x + 2), simplifying the expression yields 1/(√(x + h + 2) + √(x + 2)).
Outlines
📚 Evaluating Functions and Solving for x
This paragraph introduces a multiple-choice review of functions and graphs. It begins with a problem involving the function f(x) = x^2 - 5x + 7, where the task is to evaluate f(3). The solution involves substituting x with 3, which results in f(3) = 1, corresponding to answer choice C. The paragraph continues with a problem where f(x) = 10, and the goal is to solve for x, leading to two possible solutions, x = 14 or x = -4, with the latter being the correct answer as it's listed in the choices. The explanation emphasizes the importance of pausing the video to work through the problems independently for a more beneficial learning experience.
📈 Understanding Graphs and Functions
The second paragraph delves into identifying functions through the vertical line test. It explains that a graph represents a function if a vertical line intersects it at no more than one point. The paragraph evaluates multiple answer choices, eliminating those that fail the vertical line test due to intersecting at multiple points. The correct function, represented by answer choice B, touches the vertical line at only one point. The paragraph also covers determining the value of f(-1) from a given graph, identifying intervals of increase, decrease, and constancy in a function's behavior, and locating the relative maximum of a function, which is found at x = -2.
📉 Determining Function Behavior and Values
This paragraph focuses on identifying intervals where a function is increasing, decreasing, or constant, and it provides a method to express these intervals using union symbols and interval notation. It also explains how to find the relative minimum value of a function, which is associated with a specific y-coordinate on the graph. The paragraph includes a piecewise function example to illustrate how to determine the value of f(4), and it concludes with a discussion on how to express the domain and range of a graph using interval notation and inequalities.
🔍 Calculating the Difference Quotient
The final paragraph explains how to find the difference quotient of a given function using the formula f(x+h) - f(x) / h. It provides a step-by-step guide to simplify the expression, which involves substituting x with x+h, multiplying the numerator and denominator by the conjugate of the numerator, and then simplifying the resulting expression. The paragraph demonstrates the process of canceling terms and arriving at the final simplified form of the difference quotient, which is 1 / (sqrt(x + h + 2) + sqrt(x + 2)).
Mindmap
Keywords
💡Function
💡Graph
💡Multiple Choice
💡Evaluate
💡Absolute Value
💡Vertical Line Test
💡Piecewise Function
💡Domain
💡Range
💡Difference Quotient
💡Relative Maximum and Minimum
💡Interval Notation
Highlights
Review of functions and graphs through multiple choice questions
Evaluating a quadratic function by substituting x with a specific value
Solving for x when a function equals a constant value
Using the vertical line test to determine if a graph represents a function
Identifying the value of a function from a graph
Finding x values that correspond to a specific y value on a graph
Analyzing intervals of increasing, decreasing, and constant functions
Locating the position of a relative maximum on a graph
Determining the value of a relative minimum from a graph
Applying piecewise functions to find the value of a function
Expressing the domain and range of a graph using interval notation
Calculating the difference quotient of a function
Simplifying expressions using conjugates to cancel terms
Final expression for the difference quotient
Understanding the concept of absolute value in equations
Determining the intervals where a function is increasing, decreasing, or constant
Transcripts
Browse More Related Video

Business Calculus - Math 1329 - Section 4.3 - Derivatives of Exponential and Logarithmic Functions
Calculus AB Homework Day 1 - Review 1: Functions
Functions - Vertical Line Test, Ordered Pairs, Tables, Domain and Range
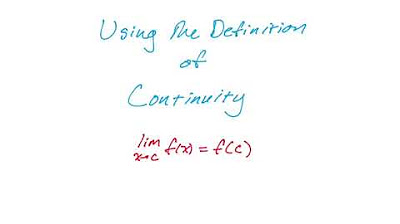
Using the Definition of Continuity in Calculus
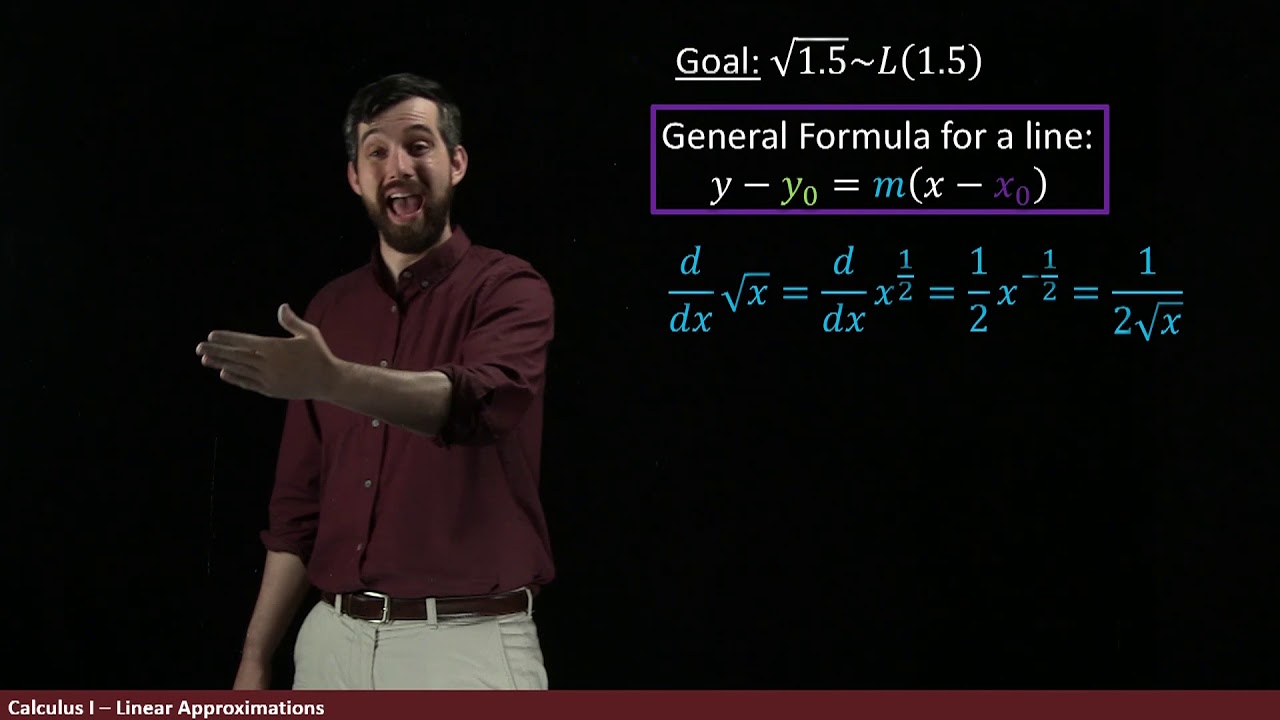
Linear Approximations | Using Tangent Lines to Approximate Functions
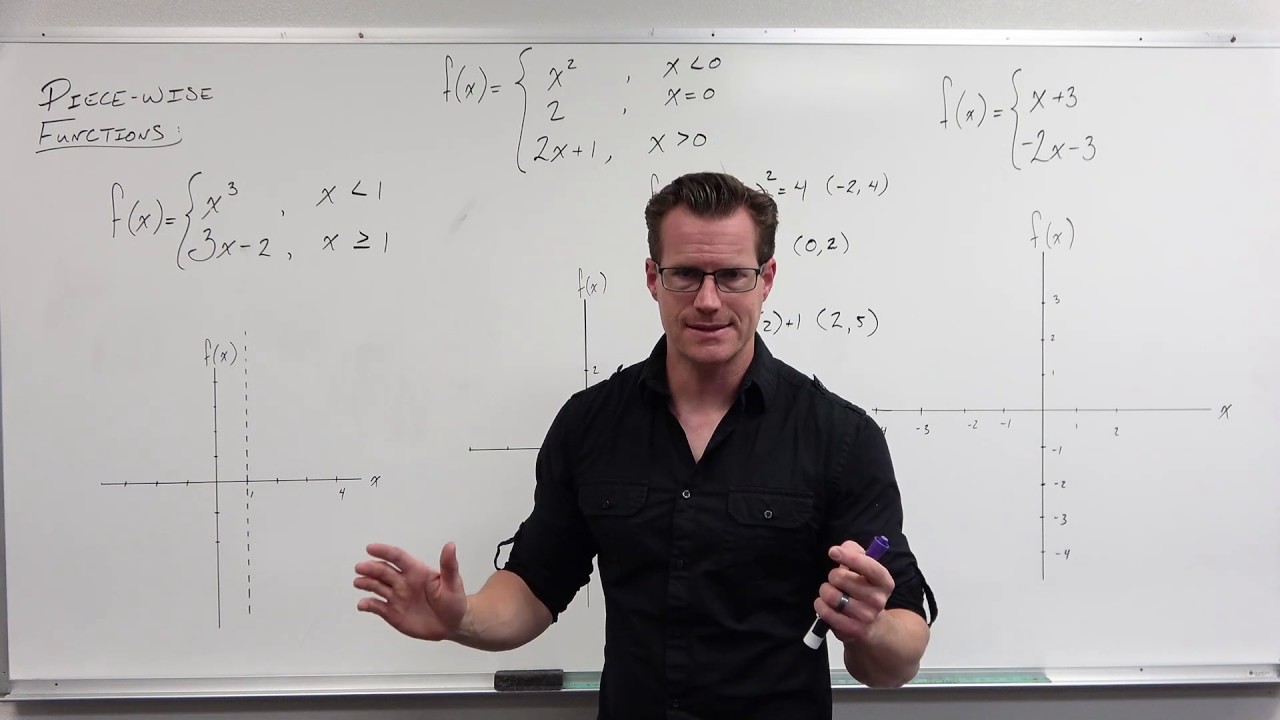
How to Graph Piecewise Functions (Precalculus - College Algebra 12)
5.0 / 5 (0 votes)
Thanks for rating: