Data Science & Statistics Tutorial: The Poisson Distribution
TLDRThis lecture delves into the Poisson Distribution, characterized by the parameter lambda, which measures the average rate of events in a given time frame. The distribution is used to calculate the probability of a specific number of events occurring within a fixed interval, such as the likelihood of receiving a certain number of questions in a day. The probability function is unique, involving lambda, Euler's number, and factorial operations. The expected value and variance of a Poisson-distributed variable are both equal to lambda, highlighting the distribution's statistical elegance. The lecture concludes with how to compute probabilities for intervals in a Poisson distribution.
Takeaways
- 📚 The Poisson Distribution is denoted as 'Po' followed by a single parameter, lambda (λ).
- 📈 It is used to model the frequency of events occurring in a fixed interval of time or space, given a constant average rate of occurrence, λ.
- 🔍 The graph of the Poisson distribution starts at 0 and has no upper limit, showing the probability of an event occurring a certain number of times.
- 🌟 Euler’s number (e), approximately 2.72, is a fundamental constant used in the Poisson probability formula.
- 🧩 The probability function for the Poisson Distribution is unique and involves λ raised to the power of y, multiplied by e to the power of -λ, all divided by y factorial.
- 📝 The probability of an event occurring exactly 'y' times can be calculated using the formula and substituting the appropriate values for λ and y.
- 🎯 The expected value of a Poisson Distribution is equal to its parameter λ, which is also the average rate of occurrence.
- 📊 The variance of the Poisson Distribution is also equal to λ, indicating that both the mean and variance are determined by the average rate.
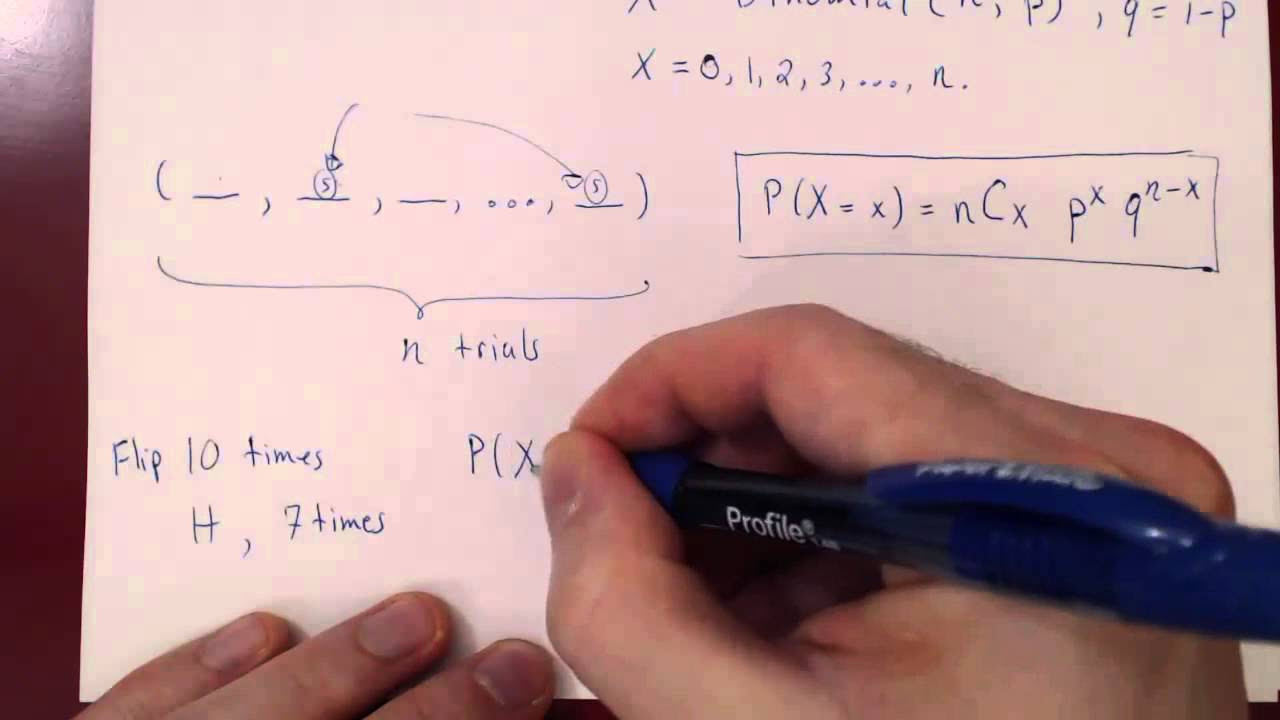
- 🤔 An example given in the script is the calculation of the probability of receiving exactly 7 questions in a day when the average is 4, illustrating the application of the Poisson formula.
- 📉 To calculate the probability of a range of outcomes in a Poisson Distribution, one sums the probabilities of all individual outcomes within that range.
- 📚 The elegance of the Poisson Distribution lies in its statistical properties, where the mean and variance are both equal to λ, making it a useful tool in various applications.
Q & A
What is the Poisson Distribution denoted by?
-The Poisson Distribution is denoted by the letters 'Po' followed by a single value parameter, lambda (λ).
How is the statement 'Variable Y follows a Poisson distribution with lambda equal to 4' read?
-It is read as 'The variable Y has a Poisson distribution with an average rate of 4 events per interval.'
What does the Poisson Distribution measure?
-The Poisson Distribution measures the frequency with which an event occurs in a specific interval of time or distance.
Can you provide an example where the Poisson Distribution would be used?
-An example is determining the likelihood of a firefly lighting up 8 times in 20 seconds, given it lights up 3 times on average in 10 seconds.
What is the starting point of the graph for the Poisson distribution?
-The graph of the Poisson distribution always starts from 0, as no event can happen a negative amount of times.
What is the average number of questions asked per day in the online course example?
-In the online course example, the average number of questions asked per day is 4.
What is the probability function of the Poisson Distribution?
-The probability function of the Poisson Distribution is given by p(y) = (e^(-λ) * λ^y) / y!, where λ is the average rate of events and y is the number of events.
What is Euler’s number and what is its approximate value?
-Euler’s number, also known as Napier’s constant, is a fixed value approximately equal to 2.72 and is commonly denoted by 'e'.
How do you calculate the expected value of a Poisson Distribution?
-The expected value of a Poisson Distribution is simply the lambda (λ) parameter, which represents the average rate of events.
What is the relationship between the mean and variance of a Poisson Distribution?
-Both the mean and variance of a Poisson Distribution are equal to the lambda (λ) parameter.
How can you compute the probability of an interval for a Poisson Distribution?
-To compute the probability of an interval for a Poisson Distribution, you find the joint probability of all individual elements within that interval.
Outlines
📚 Introduction to Poisson Distribution
This paragraph introduces the Poisson Distribution, denoted as 'Po' with a single parameter lambda. It is used to measure the frequency of an event's occurrence within a specific time interval or distance. The paragraph explains that unlike other distributions, the Poisson Distribution requires knowledge of the event's average rate of occurrence over a period. An example is given where a firefly lights up an average of 3 times in 10 seconds, and the distribution is used to calculate the probability of it lighting up 8 times in 20 seconds. The graph of the Poisson Distribution is also described, starting from 0 and having no upper limit, reflecting the possibility of an event occurring any number of times within the interval.
🔍 Understanding the Poisson Probability Function
The paragraph delves into the probability function of the Poisson Distribution, which is unique and different from other distributions. The formula for calculating the probability of a specific number of events occurring is presented, involving lambda raised to the power of 'y', multiplied by 'e' to the power of negative lambda, and divided by 'y' factorial. The paragraph provides a practical example of an online course creator who receives an average of 4 questions per day and wants to know the likelihood of receiving exactly 7 questions. The formula is broken down to explain each component, including Euler's number, and then applied to the example to calculate the probability of receiving 7 questions, which is approximately 6%.
📉 Calculating Expected Value and Variance
This paragraph explains how to calculate the expected value and variance for the Poisson Distribution. The expected value of 'Y' is defined as the sum of all products of distinct values in the sample space and their probabilities, which simplifies to lambda. Similarly, the variance is also found to be equal to lambda. The paragraph highlights the elegant statistical properties of the Poisson Distribution, where both the mean and variance are equal to lambda, making it advantageous for certain applications.
📈 Computing Probabilities for Intervals in Poisson Distribution
The final paragraph discusses how to compute the probability of an interval in a Poisson Distribution. It states that the same steps used for discrete distributions apply, where the joint probability of all individual elements within the interval is found. This method allows for the calculation of the likelihood of an event occurring within a range of values, rather than a single specific value.
Mindmap
Keywords
💡Poisson Distribution
💡Lambda (λ)
💡Frequency
💡Probability Function
💡Euler's Number (e)
💡Expected Value
💡Variance
💡Factorial
💡Online Course
💡Discrete Distribution
Highlights
Introduction to Poisson Distribution and its parameter lambda.
Poisson Distribution's focus on the frequency of event occurrences in a specific interval.
Example of firefly lighting to illustrate the concept of average occurrences over time.
Explanation of when to use Poisson Distribution for determining event likelihood.
Characteristics of the Poisson distribution graph, starting from 0 with no upper limit.
Online course example to demonstrate the application of Poisson Distribution.
Calculation of the probability of receiving exactly 7 questions using the Poisson formula.
Detailed breakdown of the Poisson probability function components.
Clarification of Euler’s number and its significance in the Poisson formula.
Explanation of the probability calculation for the online course example.
Result of the probability calculation, indicating a 6% chance of receiving 7 questions.
Introduction to calculating the expected value of a Poisson Distribution.
Derivation of the expected value being equal to lambda for a Poisson Distribution.
Variance calculation and its equivalence to lambda in Poisson Distribution.
Discussion on the elegance of statistics in Poisson Distribution and their practical advantages.
Guidance on computing the probability of an interval for a Poisson Distribution.
Transcripts
Browse More Related Video

Poisson process 2 | Probability and Statistics | Khan Academy
Bernoulli, Binomial and Poisson Random Variables

Poisson process 1 | Probability and Statistics | Khan Academy

Introduction to Poisson Distribution - Probability & Statistics
Poisson Distribution in R | R Tutorial 3.2 | MarinStatsLectures

Types Of Distribution In Statistics | Probability Distribution Explained | Statistics | Simplilearn
5.0 / 5 (0 votes)
Thanks for rating: