Discrete v/s Continuous Data - What ? How ? || Discrete Data || Continuous Data || Basic Statistics
TLDRThis video delves into the concepts of discrete and continuous data, essential for understanding numerical data analysis. Discrete data is characterized by fixed, finite values within a specific range, such as the number of students in a class, and is often visualized with bar charts or pie charts. In contrast, continuous data can take any value within a range, like students' weights, and is typically represented with histograms or scatter plots. The video explains the differences between the two, highlighting that discrete data is counted and does not change with time, while continuous data is measured, can be more precise, and changes over time. Examples and clear distinctions are provided to clarify these concepts for viewers.
Takeaways
- 📊 Discrete Data is numerical data that takes fixed finite values in a specific range, with a limited number of possible values.
- 📚 Discrete data cannot be broken down into smaller parts, and it is nearly impossible to measure between two fixed values, such as having 30.5 students in a class.
- 🏫 An example of discrete data is the number of students in a class, which is a finite number and does not change with time.
- 📈 Discrete data is visualized using bar charts or pie charts, and when plotted on a line chart, it shows points at specific integer values without a smooth line.
- 🔢 Discrete data is counted, such as the whole number of students in a class or fixed number types like shoe sizes.
- 📉 Continuous Data, in contrast, can take any value in a specified range and can be broken down into smaller, more precise parts.
- 🌡️ An example of continuous data is the weight of students, which can be fractional and change over time, such as 45.5 kgs.
- 📊 Continuous data is visualized using histograms and scatterplots, and when plotted on a line chart, it forms a smooth continuous line.
- 📏 Continuous data is measured, such as with a weighing machine, and cannot be counted like discrete data.
- 🔢 Examples of continuous data include the weight of students, height of a person, and time, which can be any decimal number.
- 🔑 The main differences between discrete and continuous data include their nature (counted vs. measured), range of values (finite vs. any in a range), and representation (bar/pie charts vs. histograms/scatter plots).
Q & A
What is Discrete Data?
-Discrete data are numerical data that can only take a finite number of values within a specific range. These values are distinct and noncontinuous, such as the number of students in a class, which cannot be a fraction.
Can you provide an example of Discrete Data?
-An example of discrete data is the number of students in a class, which is a finite count and cannot be broken down into smaller parts like fractions.
What is Continuous Data?
-Continuous data are numerical data that can take any value within a specified range. These values are infinite and can be fractional, such as the weight of students in a class.
Can you give an example of Continuous Data?
-An example of continuous data is the weight of students in a class, which can be any value from 30kg to 100kg, including fractional weights like 45.5 kgs.
How is Discrete Data different from Continuous Data?
-Discrete data has a finite number of distinct values and cannot be fractional, while continuous data can have infinite values and can include fractions.
How can Discrete Data be represented graphically?
-Discrete data can be represented using bar charts or pie charts, and when plotted on a line chart, it shows points at specific integer values without a continuous line.
What type of graph is suitable for representing Continuous Data?
-Continuous data is best represented using histograms and scatterplots. On a line chart, continuous data forms a smooth continuous line.
How is Discrete Data typically collected?
-Discrete data is typically collected by counting, such as counting the number of students in a class or the number of tyres in a vehicle.
How is Continuous Data collected?
-Continuous data is collected through precise measurements, such as using a weighing machine to measure the weight of students.
Does Discrete Data change with time?
-Generally, discrete data does not change with time. For example, the number of students in a class remains constant unless there are additions or deletions.
Is it possible for Continuous Data to change over time?
-Yes, continuous data often changes with time. For instance, the weight of students can change monthly due to growth or dietary changes.
What are some other examples of Discrete Data mentioned in the script?
-Other examples of discrete data mentioned in the script include the number of tyres in a vehicle and shoe sizes like 2, 2.5, 3, 3.5.
What are some other examples of Continuous Data mentioned in the script?
-Other examples of continuous data mentioned in the script include the height of a person and time, which can be measured in any decimal value.
Outlines
📊 Understanding Discrete and Continuous Data
This paragraph introduces the concepts of discrete and continuous data, two fundamental types of numerical data. Discrete data is characterized by fixed finite values within a specific range and can include examples such as the number of students in a class or shoe sizes. It is non-continuous and cannot be broken down into smaller parts, making it countable rather than measurable. On the other hand, continuous data can take any value within a range and is infinitely divisible, as exemplified by the weight of students. It is continuous, measurable, and can change over time. The paragraph also explains how discrete data is visualized using bar charts and pie charts, while continuous data is represented by histograms and scatterplots. The differences between the two are summarized in terms of meaning, precision, nature, values, graphical representation, and whether they change with time.
📝 Conclusion and Call to Action
The final paragraph serves as a conclusion to the video, summarizing the key differences between discrete and continuous data. It invites viewers to engage by sharing their thoughts or asking questions in the comment section and encourages them to subscribe for more informative videos. The paragraph ends with a friendly sign-off, promising to meet the audience in the next video.
Mindmap
Keywords
💡Discrete Data
💡Continuous Data
💡Numerical Data
💡Quantitative Data
💡Bar Charts
💡Pie Charts
💡Histograms
💡Scatterplots
💡Precision
💡Sensitivity of the Scale
Highlights
Discrete data takes fixed finite values in a specific range, unlike continuous data which can take infinite values between two distinct points.
Numerical data, also known as quantitative data, can be divided into discrete and continuous data types.
Discrete data can only take a finite value in a specific range with a limited number of possible values.
An example of discrete data is the number of students in a class, which is always a finite number.
Discrete data cannot be broken down into smaller parts and cannot represent fractional values.
Discrete data consists of distinct or unconnected elements which are noncontinuous in nature.
Discrete data does not change with time, such as the number of students in a class remaining constant over months.
Discrete data can be visualized using bar charts or pie charts for statistical data analysis.
When plotted on a line chart, discrete data represents values at specific points along the number line.
Discrete data is counted and not measured, such as counting the number of students in a class.
Examples of discrete data include the number of students in a class, the number of tyres in a vehicle, and shoe sizes.
Continuous data can take up any value in a specified range, such as the weight of students in a class.
Continuous data can be broken down into smaller parts for precision, like fractional weights of students.
Continuous data consists of connected elements which are continuous in nature.
Continuous data changes with time, like the weight of students which can change monthly.
Continuous data is visualized using histograms and scatterplots for statistical data analysis.
When plotted on a line chart, continuous data represents a smooth continuous line.
Continuous data is measured and cannot be counted, such as using a weighing machine for student's weight.
Examples of continuous data include the weight of students in a class, height of a person, and time.
The difference between discrete and continuous data includes aspects like meaning, precision, nature, values, graphical representation, and changes with time.
Transcripts
Browse More Related Video
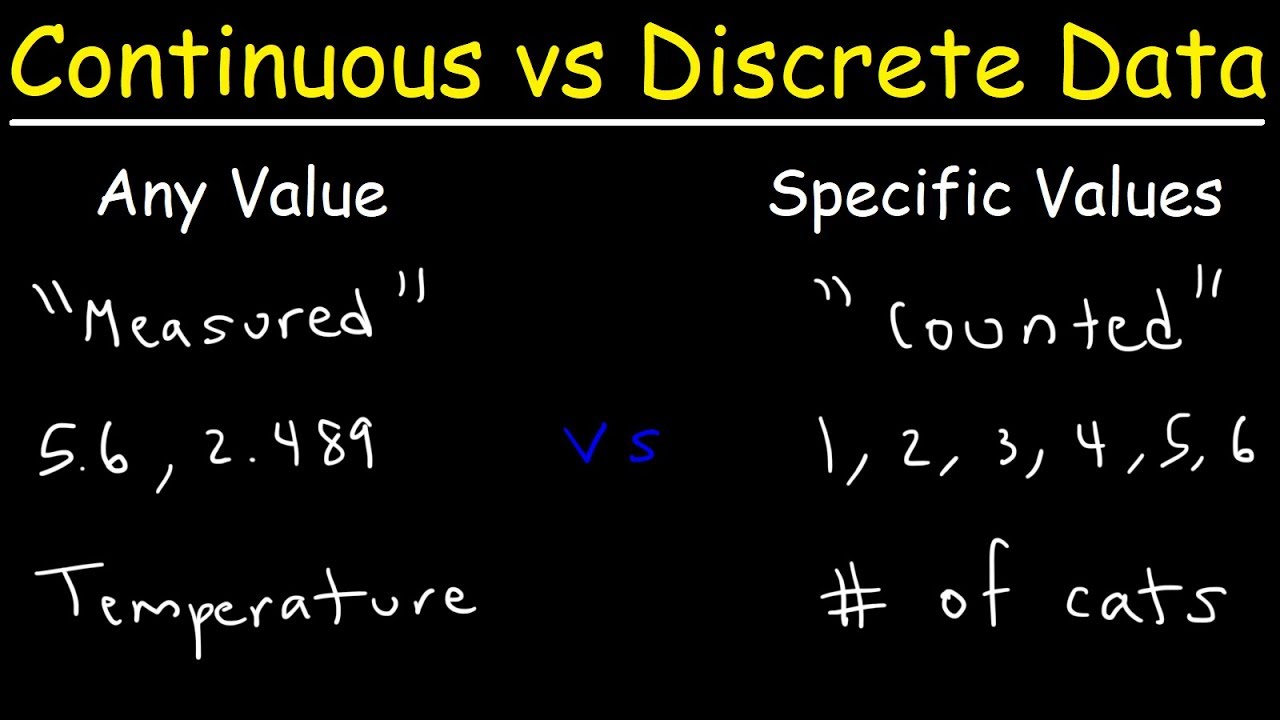
Continuous vs Discrete Data
Descriptive statistics and data visualisation. An introduction to statistics and working with data
Types of Data: Categorical vs Numerical Data

Qualitative and Quantitative Data

Discrete and continuous random variables | Probability and Statistics | Khan Academy
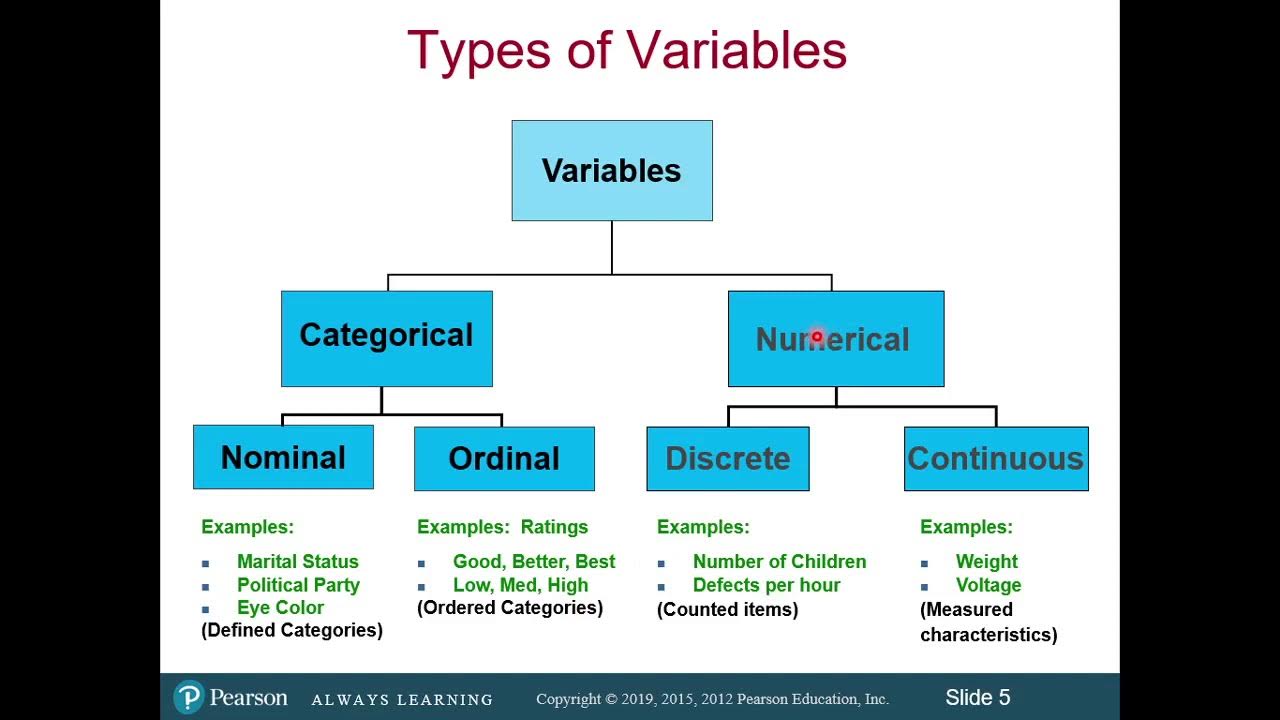
Classification of Variables and Types of Measurement Scales
5.0 / 5 (0 votes)
Thanks for rating: