Factor Analysis (Principal Components Analysis) with Varimax Rotation in SPSS
TLDRDr. Grande's video offers a comprehensive guide on conducting a factor analysis with varimax rotation in SPSS. The video begins with an introduction to the purpose of factor analysis, which is to uncover the underlying constructs within an assessment. Using a fictitious dataset, Dr. Grande demonstrates the process step by step, starting from the selection of variables to the interpretation of results. The video emphasizes the importance of understanding data structure, the distinction between factor analysis and principal components analysis, and the significance of statistical indicators like KMO and Bartlett's test. It also explains the decision-making process regarding the number of factors to extract and the use of the eigenvalue greater than one rule. The demonstration includes the application of varimax rotation, a popular orthogonal rotation, and the interpretation of the rotated component matrix to identify item groupings that measure the same construct. Dr. Grande advises on refining the instrument by removing items with low factor loadings to improve the assessment's construct validity. The video concludes with an invitation for viewers to reach out with questions, reinforcing the presenter's commitment to assisting with statistical analysis.
Takeaways
- 📊 **Factor Analysis Purpose**: To explore underlying constructs in an assessment to understand what the assessment measures.
- 🔍 **Data Structure Importance**: Understanding the data structure is crucial before starting factor analysis to ensure accurate results.
- 📈 **Principal Components Analysis (PCA)**: Often confused with factor analysis, PCA is used in the example, which differs from traditional factor analysis.
- 📝 **Selection of Variables**: Include only the assessment items in the analysis, excluding identifiers like ID numbers.
- 🔢 **Eigenvalue Criterion**: Use an eigenvalue greater than 1 as a criterion for extracting factors, although this can be adjusted based on the analysis.
- 🤔 **Rotation Types**: Choose between orthogonal (no high correlation assumed) and oblique (high correlation assumed) rotation methods.
- 📉 **Descriptive Statistics**: Review means, standard deviations, and the number of responses to ensure no missing data and understand item variance.
- 🔗 **Correlation Matrix**: Look for correlations stronger than 0.8 as they might indicate redundancy or issues with the items.
- 📋 **KMO and Bartlett's Test**: These tests assess the suitability of the data for factor analysis, with values above 0.5 and significant p-values being acceptable.
- 📊 **Total Variance Explained**: Factor analysis results indicate the number of components explaining the variance in the data.
- ⚙️ **Iterative Process**: Factor analysis is an iterative process where items with low factor loadings can be removed to improve the instrument's properties.
Q & A
What is the primary purpose of conducting a factor analysis?
-The primary purpose of conducting a factor analysis is to explore the underlying constructs in an assessment. It helps to identify groupings of items that hold together, indicating they may be measuring the same construct.
What is the difference between factor analysis and principal components analysis?
-Factor analysis is used to identify underlying latent constructs in a set of observed variables, while principal components analysis is a technique used to reduce the dimensionality of the data by transforming the original variables into a set of linearly uncorrelated variables called principal components. Although they are often used interchangeably, they serve different analytical purposes.
Why is it important to understand the data structure before starting a factor analysis?
-Understanding the data structure is crucial because it influences the choice of statistical methods and the interpretation of the results. It helps in determining whether the data is suitable for factor analysis and what type of rotation (orthogonal or oblique) should be used during the analysis.
What does an eigenvalue greater than 1 signify in factor analysis?
-An eigenvalue greater than 1 is a criterion used to decide how many factors to extract in a factor analysis. It suggests that the corresponding component explains a significant amount of variance in the data.
What is the role of the KMO and Bartlett's test in factor analysis?
-The KMO (Kaiser-Meyer-Olkin) test measures the suitability of the data for factor analysis, with values greater than 0.5 indicating that factor analysis is appropriate. Bartlett's test of sphericity checks whether the correlation matrix is an identity matrix, with a significant result (p < 0.05) suggesting that the data is suitable for factor analysis.
What is the significance of the rotated component matrix in factor analysis?
-The rotated component matrix provides a simplified structure of the data that is easier to interpret. It shows how the variables (items) load onto the identified factors, helping to understand which items group together and thus measure the same underlying construct.
What is the Varimax rotation and why is it commonly used?
-Varimax rotation is an orthogonal rotation technique used in factor analysis that aims to maximize the variance of the squared loadings for each factor. It is popular because it simplifies the factor structure by spreading the highest loadings across different factors, making it easier to interpret.
How does removing an item with a low factor loading impact the factor analysis results?
-Removing an item with a low factor loading can improve the clarity and interpretability of the factor structure. It may result in a more coherent grouping of items, higher factor loadings, and better-defined constructs.
What is the minimum acceptable KMO value for conducting factor analysis?
-The minimum acceptable KMO value for conducting factor analysis is 0.5. However, values closer to 1 indicate a stronger suitability for factor analysis.
What does it mean if an item loads well on more than one component in the rotated component matrix?
-If an item loads well on more than one component, it suggests that the item may be measuring more than one construct. This could indicate a need for further refinement of the assessment instrument or a closer examination of the item's content.
How can the process of running factor analysis help in the development of an assessment instrument?
-Running factor analysis helps in the development of an assessment instrument by identifying the underlying constructs that the items measure. By iteratively removing items with low factor loadings and re-running the analysis, researchers can refine the instrument to ensure that it accurately and reliably measures the intended constructs.
Outlines
📊 Introduction to Factor Analysis with Varimax Rotation in SPSS
Dr. Grande introduces the concept of factor analysis and its application in exploring the underlying constructs of an assessment. He uses a fictitious dataset with an ID number and ten items from an assessment, emphasizing the importance of understanding the data structure. The video explains that factor analysis can reveal groupings of items that measure the same construct, but it does not define the constructs themselves. The distinction between factor analysis and principal components analysis is clarified, with the latter being used in the demonstration. The steps to conduct factor analysis in SPSS are outlined, including selecting the appropriate variables, choosing the method of extraction, and deciding on the number of factors to extract based on eigenvalues.
📈 Descriptive Statistics and Correlation Matrix Analysis
The video script details the output of a factor analysis, starting with descriptive statistics that include means, standard deviations, and the number of responses for each item. It then discusses the correlation matrix, where the focus is on identifying correlations stronger than 0.8, which could indicate redundancy. The determinant value and KMO and Bartlett's test results are examined for their suitability for factor analysis. The total variance explained by the components is also discussed, with the eigenvalue of one used as a criterion for component retention. The rotated component matrix is then interpreted, showing how items load onto different components, indicating which items measure the same construct.
🔍 Refining the Factor Analysis by Removing Items
The paragraph explains the process of refining a factor analysis by removing items that do not fit well with the identified constructs. Initially, item nine is removed due to its low factor loading. The analysis is rerun, and the results show a decrease in the number of factors explaining the variance. The rotated component matrix is again examined, and item one is subsequently removed because it does not load strongly with other items. The process is repeated, and the final rotated component matrix is evaluated for acceptability, with factor loadings of 0.45 or greater being the target for a good fit.
📝 Conclusion and Final Thoughts on Factor Analysis
Dr. Grande concludes the video by summarizing the process of running a factor analysis, which involves examining the constructs indicated by the results and making adjustments to the items included in the assessment. He notes that most assessments in counseling have more than ten items, and the process involves an iterative refinement of the instrument by removing items with low factor loadings. The goal is to achieve a rotated component matrix that clearly defines the constructs being measured. Dr. Grande offers help for any questions or concerns, emphasizing the importance of understanding and applying factor analysis in assessment development.
Mindmap
Keywords
💡Factor Analysis
💡Varimax Rotation
💡SPSS
💡Eigenvalue
💡Component Matrix
💡Constructs
💡Principal Components Analysis (PCA)
💡Descriptive Statistics
💡Correlation Matrix
💡Kaiser-Meyer-Olkin (KMO) Test
💡Bartlett's Test of Sphericity
💡Factor Loading
Highlights
Dr. Grande introduces a video tutorial on conducting a factor analysis with varimax rotation in SPSS.
A fictitious dataset with an ID number and ten assessment items is used for demonstration.
Factor analysis aims to explore the underlying constructs within an assessment.
The distinction between factor analysis and principal components analysis is clarified.
The process of conducting a factor analysis in SPSS is outlined step by step.
The importance of the KMO and Bartlett's test for assessing the adequacy of the correlation matrix is discussed.
Criteria for a good factor structure, such as eigenvalues greater than 1, are explained.
Different types of rotations (orthogonal and oblique) are introduced based on the correlation assumption between variables.
The use of varimax rotation, a popular orthogonal rotation, is demonstrated.
Descriptive statistics, means, standard deviations, and correlations are reviewed for the dataset.
The concept of factor loadings and their significance in determining which items load onto a factor is explained.
The rotated component matrix is used to interpret the results and identify the constructs measured by the assessment.
The process of iteratively refining the instrument by removing items with low factor loadings is demonstrated.
The impact of removing item 9 on the factor analysis results is shown, leading to a clearer structure.
Further refinement by removing item 1 results in an improved and more acceptable factor structure.
The importance of factor loadings of 0.45 or greater for a good factor structure is emphasized.
The final acceptable result presents four components explaining 64% of the variance.
Dr. Grande concludes with a summary of the factor analysis process and its utility in instrument development.
Transcripts
Browse More Related Video
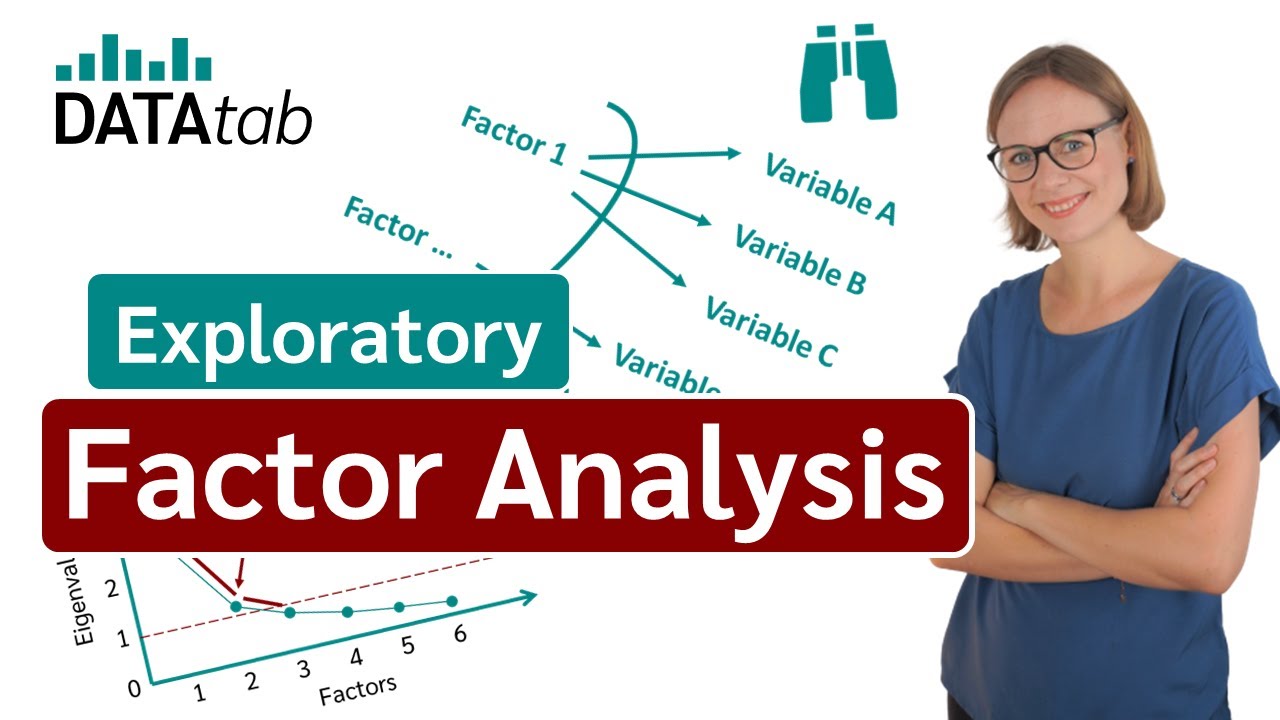
Exploratory Factor Analysis
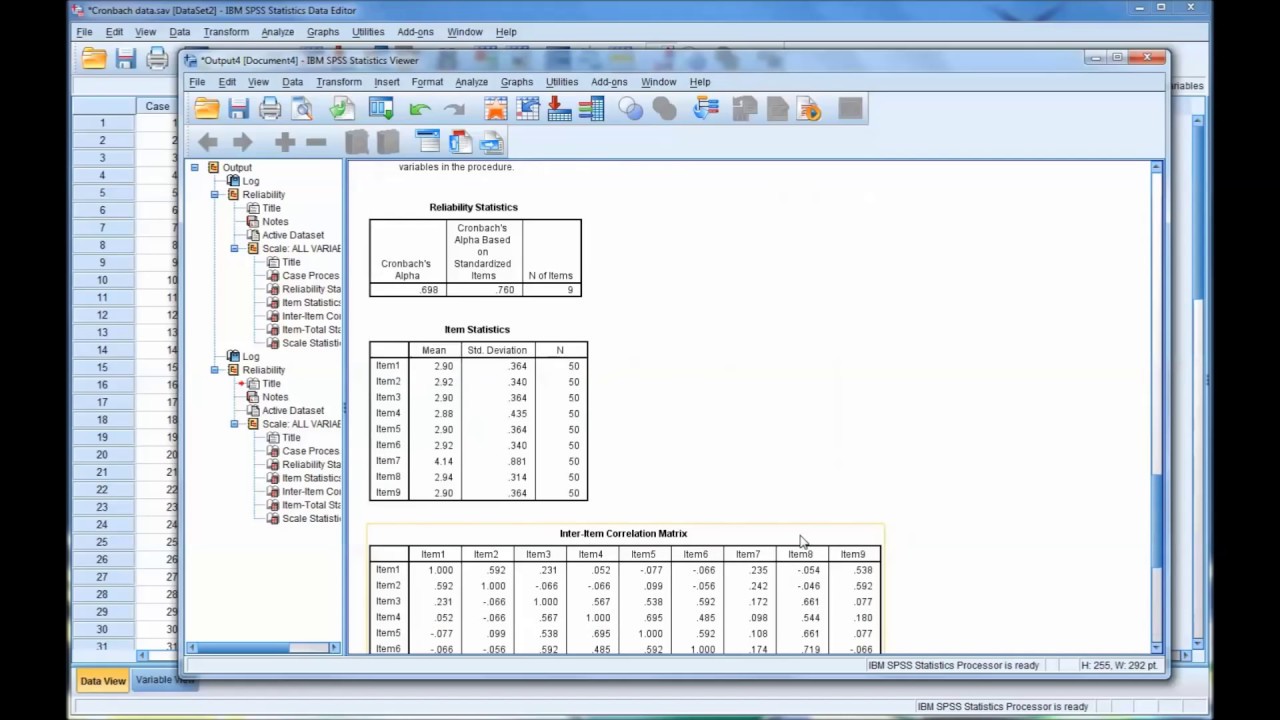
Calculating and Interpreting Cronbach's Alpha Using SPSS
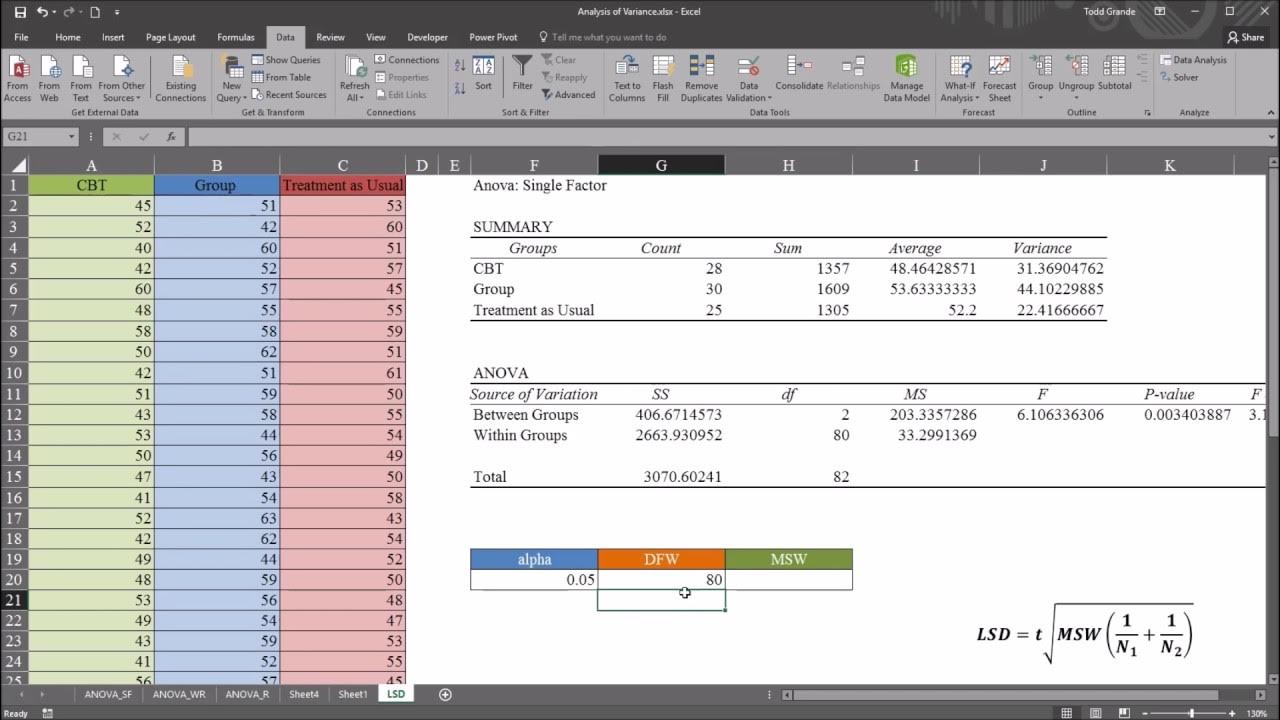
One-Way ANOVA with LSD (Least Significant Difference) Post Hoc Test in Excel

Cronbach's alpha or Coefficient alpha in simple language - DU Professor
Pretest and Posttest Analysis with ANCOVA and Repeated Measures ANOVA using SPSS
Statistics 101: ANCOVA in Excel, What's Going On?
5.0 / 5 (0 votes)
Thanks for rating: