Exploratory Factor Analysis
TLDRExploratory Factor Analysis (EFA) is a statistical technique used to uncover the underlying structure of a large set of variables by identifying groups of variables that are highly intercorrelated. The goal is to simplify data by reducing it to a smaller set of unobserved factors. In the video, the process begins with calculating the correlation matrix to understand how traits correlate. Then, using the eigenvalue criterion or the scree test, the optimal number of factors is determined. The analysis continues with calculating communalities, which indicate how much variance can be explained by the factors. The component matrix provides factor loadings, showing the correlation between variables and factors. Finally, a rotation method like Varimax is applied to achieve clearer factor structures. The video uses an example of personality traits to illustrate how traits like outgoing and sociable might be grouped under the factor of extraversion, while hardworking and dutiful under conscientiousness, and warm-hearted and helpful under agreeableness. The researcher's task is to interpret and name the factors based on the rotated component matrix.
Takeaways
- 🔍 **Exploratory Factor Analysis (EFA)** is a statistical method used to identify underlying relationships between observed variables.
- 📈 EFA aims to group variables that are highly correlated, suggesting they are influenced by a common underlying factor.
- 🔗 The correlation matrix is crucial in EFA as it shows the strength of relationships between different variables.
- 📊 Eigenvalues and eigenvectors are calculated from the correlation matrix to help understand the variance explained by each factor.
- 📉 The total variance explained by each factor is used to determine the number of factors to retain in the analysis.
- 🤔 Two common methods to decide the number of factors are the eigenvalue criterion (eigenvalues > 1) and the scree test (visual inspection for an 'elbow' in the plot).
- 📌 Factor loadings indicate the correlation between a variable and a factor, with higher values suggesting a stronger relationship.
- 🧩 Communalities represent the proportion of variance in a variable that can be explained by the factors.
- 🔄 Rotation of the component matrix, such as Varimax rotation, is often used to simplify the factor structure and aid interpretation.
- 📝 The researcher has the responsibility to name the factors based on the rotated component matrix and the context of the study.
- 🔑 The example in the script demonstrated how personality traits can be grouped into broader factors, such as extraversion, conscientiousness, and agreeableness.
Q & A
What is exploratory factor analysis?
-Exploratory factor analysis is a method used to uncover the underlying structure in a dataset with many variables. It aims to group variables that are highly correlated with each other, assuming that this correlation is due to an underlying, unmeasurable variable called a 'factor'.
How does factor analysis help in understanding correlations between variables?
-Factor analysis identifies groups of variables that correlate highly with each other, suggesting that they may be influenced by the same underlying factor. It helps to simplify complex datasets by reducing them to a smaller set of factors that explain the observed correlations.
What is a 'factor' in the context of factor analysis?
-In factor analysis, a 'factor' is considered a hidden or latent variable that influences several observed variables. It represents an unobservable phenomenon that causes a pattern of correlations among the observed variables.
How is the correlation matrix used in factor analysis?
-The correlation matrix provides an overview of how strongly individual traits or variables correlate with each other. It serves as the basis for calculating eigenvalues and eigenvectors, which are essential for determining the factors that explain the variance in the data.
What are eigenvalues and eigenvectors in the context of factor analysis?
-Eigenvalues and eigenvectors are mathematical tools used in factor analysis. Eigenvalues indicate the amount of variance that can be explained by each factor, while eigenvectors provide the direction of the factor in the variable space.
How are the number of factors determined in a factor analysis?
-The number of factors is typically determined using the eigenvalue criterion, which involves selecting the number of factors that have eigenvalues greater than one. Alternatively, the scree test, a graphical method that looks for an 'elbow' in a plot of eigenvalues, can also be used.
What is the purpose of rotating the component matrix in factor analysis?
-Rotation of the component matrix aims to simplify the factor structure and make it easier to interpret. It ensures that each factor has high loadings for certain variables and low loadings for others, thus helping to clearly assign variables to factors and form distinct groups.
What are communalities in factor analysis?
-Communalities represent the proportion of the variance in each variable that can be explained by the set of factors. They indicate how much of the variance in the variables is shared or common and can be accounted for by the factors.
How does the factor loading indicate the relationship between a variable and a factor?
-Factor loadings indicate the correlation between a variable and a factor. A high factor loading suggests that the variable is strongly associated with the factor, meaning that the factor has a significant influence on the variable.
What is the final step in interpreting the results of a factor analysis?
-The final step in interpreting the results of a factor analysis is to assign the variables to the factors based on the rotated component matrix. This step forms the groups of variables that are most strongly associated with each factor.
Who is responsible for naming the factors identified in a factor analysis?
-The researcher or analyst is responsible for naming the factors. The factor analysis itself does not provide names for the factors; it is up to the researcher to interpret the factors based on the patterns of variable loadings and to assign appropriate labels.
How can factor analysis be applied to personality traits?
-Factor analysis can be used to group various personality traits into broader personality types, such as the Big Five personality traits (conscientiousness, extraversion, openness, agreeableness, and neuroticism). By examining the correlations between different traits, researchers can identify underlying factors that may represent these broader personality types.
Outlines
📊 Introduction to Exploratory Factor Analysis
The video begins by defining exploratory factor analysis (EFA) as a method for uncovering structures within data sets with many variables. EFA aims to group interrelated variables based on their correlations. The concept of a 'factor' is introduced as a hidden variable that influences observed variables. An example is given involving personality traits and how they might be grouped into broader personality types using EFA. The process of EFA is outlined, including calculating correlations, determining the number of factors, and interpreting results using a correlation matrix and eigenvalues.
🔍 Understanding Correlations and Factor Determination
This paragraph delves into the correlation matrix, which provides an overview of how different traits correlate with each other. It explains the importance of eigenvalues and eigenvectors in factor analysis and how they are used to calculate the total variance explained by each factor. The paragraph also discusses two common methods for determining the number of factors needed: the eigenvalue criterion and the scree test. It highlights the challenge of interpreting these methods and emphasizes the use of the eigenvalue criterion when the scree test is inconclusive. The concept of communalities is introduced, indicating how much variance of the variables can be explained by the factors.
🔢 Factor Loadings, Eigenvalues, and Communalities
The paragraph explains the significance of factor loadings, eigenvalues, and communalities in the context of factor analysis. Factor loadings represent the correlation between a variable and a factor, eigenvalues indicate the amount of variance explained by a factor, and communalities show how much variance of all variables can be explained by the factors combined. The paragraph also discusses the process of obtaining a satisfactory result where variables are clearly assigned to specific factors. This involves looking at the component matrix and performing a rotation, typically using the varimax rotation method, to achieve a clearer factor structure. The rotated component matrix allows for the assignment of variables to factors, forming distinct groups.
🏁 Conclusion and Final Remarks
The final paragraph summarizes the entire procedure of factor analysis as demonstrated in the video. It recaps the steps from copying data into a table, calculating the correlation matrix, determining the number of factors using the eigenvalue criterion, calculating communalities, examining the component matrix, and finally interpreting the rotated component matrix to assign personality traits to factors. The video concludes by emphasizing that the researcher has the responsibility to name the factors based on the results of the analysis. The host signs off, expressing hope that the viewers enjoyed the tutorial and inviting them to join again for the next video.
Mindmap
Keywords
💡Exploratory Factor Analysis
💡Correlation
💡Factor
💡Eigenvalues and Eigenvectors
💡Communalities
💡Component Matrix
💡Rotation
💡Personality Traits
💡Big Five Personality Traits
💡Data Tab
💡Variance
Highlights
Exploratory factor analysis is a method used to uncover structures in datasets with many variables.
The goal is to divide variables into groups based on high correlations between them.
Factor analysis assumes correlations are due to underlying unmeasurable variables called 'factors'.
An example involves grouping personality traits into types like conscientiousness, extraversion, or openness.
A small survey is created to find correlations between traits like outgoing, sociable, hard-working, etc.
The results of the survey are analyzed using an Excel spreadsheet.
Data is inputted into a statistics calculator for factor analysis.
A correlation matrix is used to understand how strongly individual traits correlate with each other.
Eigenvalues and eigenvectors are calculated from the correlation matrix to understand variance explained by factors.
The number of factors needed is determined using the eigenvalue criterion and the scree test.
Communalities are calculated to indicate how much variance of variables can be explained by factors.
Factor loading, eigenvalue, and commonality are key terms in factor analysis.
The component matrix provides factor loadings, which indicate correlations between factors and variables.
Rotation of the component matrix, such as varimax rotation, helps to optimally distribute variables among factors.
After rotation, variables are assigned to factors based on highest factor loadings.
Researchers determine the names of the factors based on the results of the analysis.
The procedure concludes with assigning personality traits to factors, such as extraversion for outgoing and sociable traits.
The final step is the interpretation of the rotated component matrix to understand the factor structure.
Transcripts
Browse More Related Video

Factor Analysis (Principal Components Analysis) with Varimax Rotation in SPSS

One Factor vs. Two Factor ANOVA [One Way vs Two Way]
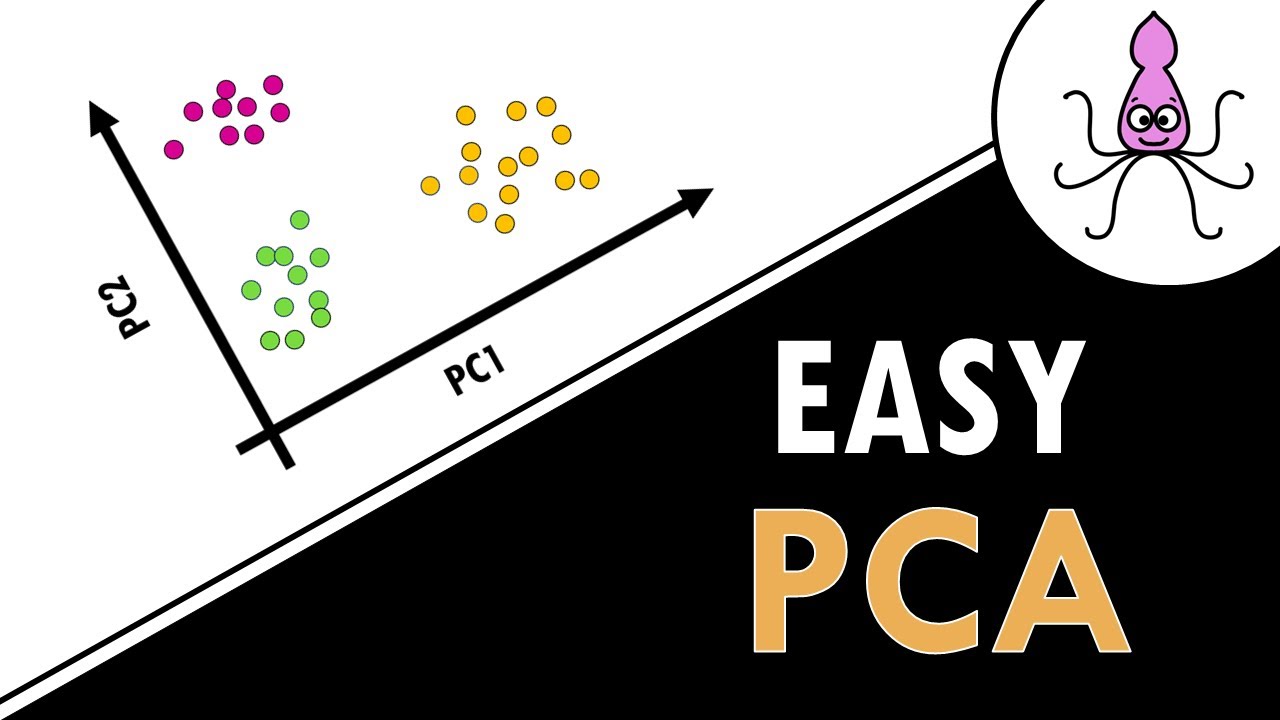
Principal Component Analysis (PCA) - easy and practical explanation
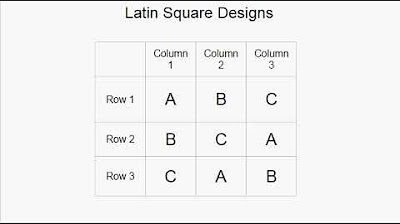
Latin Square Designs
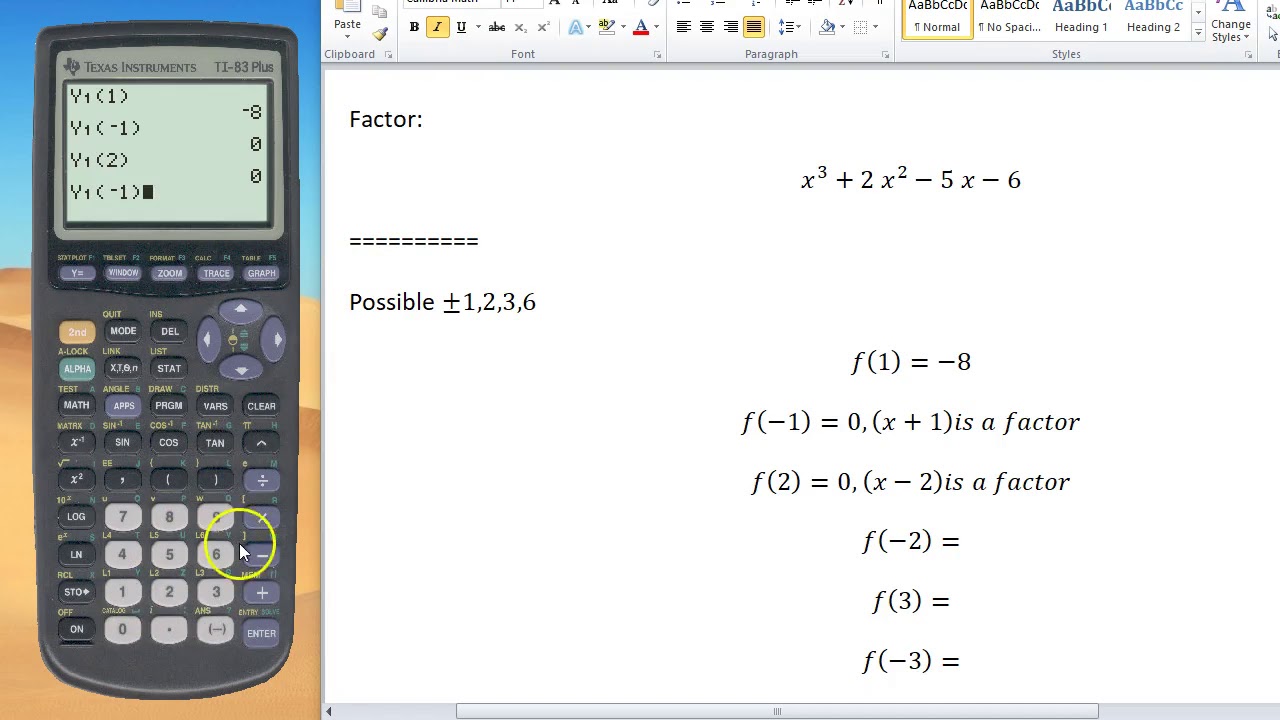
How to Factor w/ TI 83/84 Graphing Calculator
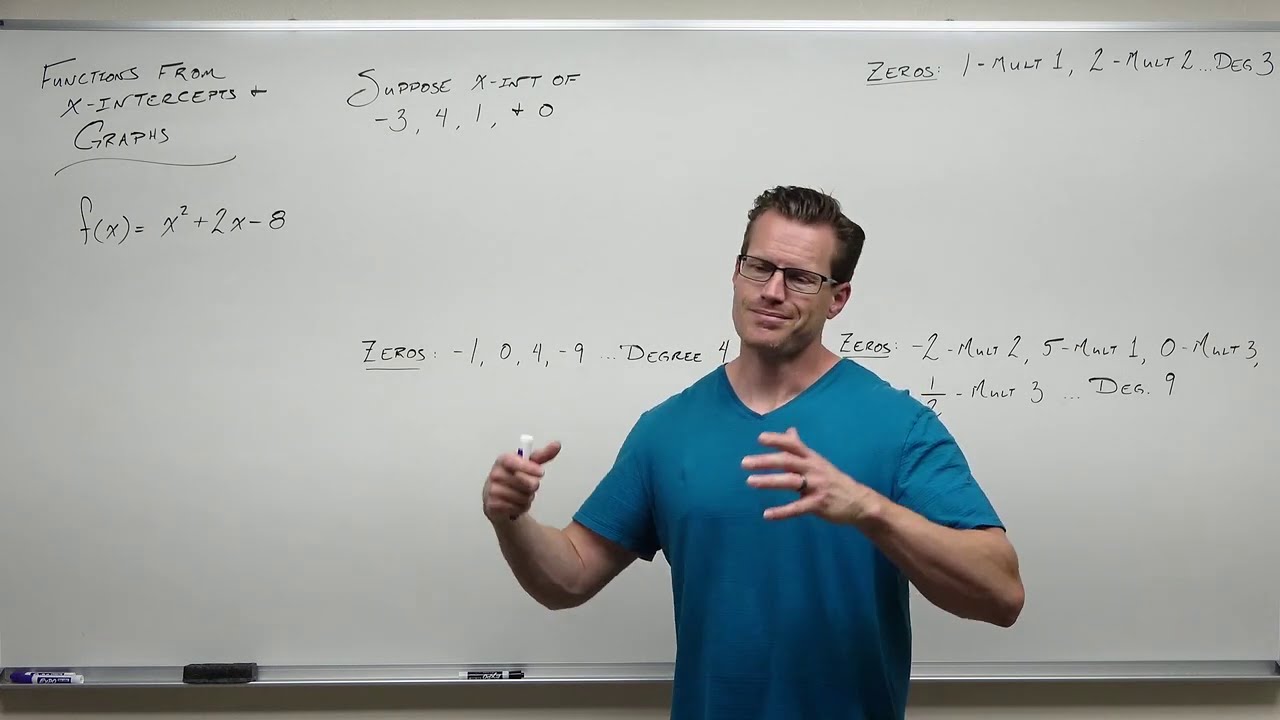
Creating Polynomials from Real Zeros (Precalculus - College Algebra 30)
5.0 / 5 (0 votes)
Thanks for rating: