Excel Math - Addition, Subtraction, Multiplication, Division & Exponents
TLDRThe video script provides an informative guide on using basic mathematical functions in Excel. It covers addition, subtraction, multiplication, and division, both with direct numbers and using cell references. The script also explains how to perform exponential operations, calculate square roots, and dynamically update calculations when cell values change. Further, it introduces functions for calculating the sum, average, maximum, minimum, range, and standard deviation of a set of numbers, which are particularly useful for statistical analysis. Additionally, the script touches on calculating variance and evaluating trigonometric functions in both degrees and radians. This comprehensive overview makes Excel an indispensable tool for anyone dealing with numerical data.
Takeaways
- 📊 **Addition in Excel**: You can perform addition by typing in the equals sign followed by the numbers you want to add, just like a calculator.
- 📊 **Using Cell References for Addition**: To add values from specific cells, type in the equals sign, reference the cell, and then use the plus symbol to add another cell reference.
- ➖ **Subtraction in Excel**: Subtraction is done similarly to addition, by using the minus symbol between numbers or cell references.
- ➗ **Multiplication in Excel**: To multiply, use the multiplication symbol (shift 8) between numbers or cell references.
- 📈 **Division in Excel**: Division is achieved by using the division symbol (backslash) between two numbers or cell references.
- 🔢 **Exponents in Excel**: To calculate exponents, use the caret symbol to raise a number to a power.
- √ **Square Root Function**: Excel provides a square root function that can be used on numbers or cell references.
- 🔄 **Dynamic Formulas**: Changes in cell values will automatically update calculations in formulas.
- 📊 **Sum Function**: Excel's SUM function can be used to calculate the total of a range of numbers by highlighting the cells.
- 📉 **Average Function**: The AVERAGE function calculates the mean of a set of numbers.
- 🔝 **Max Function**: The MAX function identifies the highest number in a range.
- 🔽 **Min Function**: The MIN function identifies the lowest number in a range.
- 📐 **Range Calculation**: The range is the difference between the maximum and minimum values in a data set.
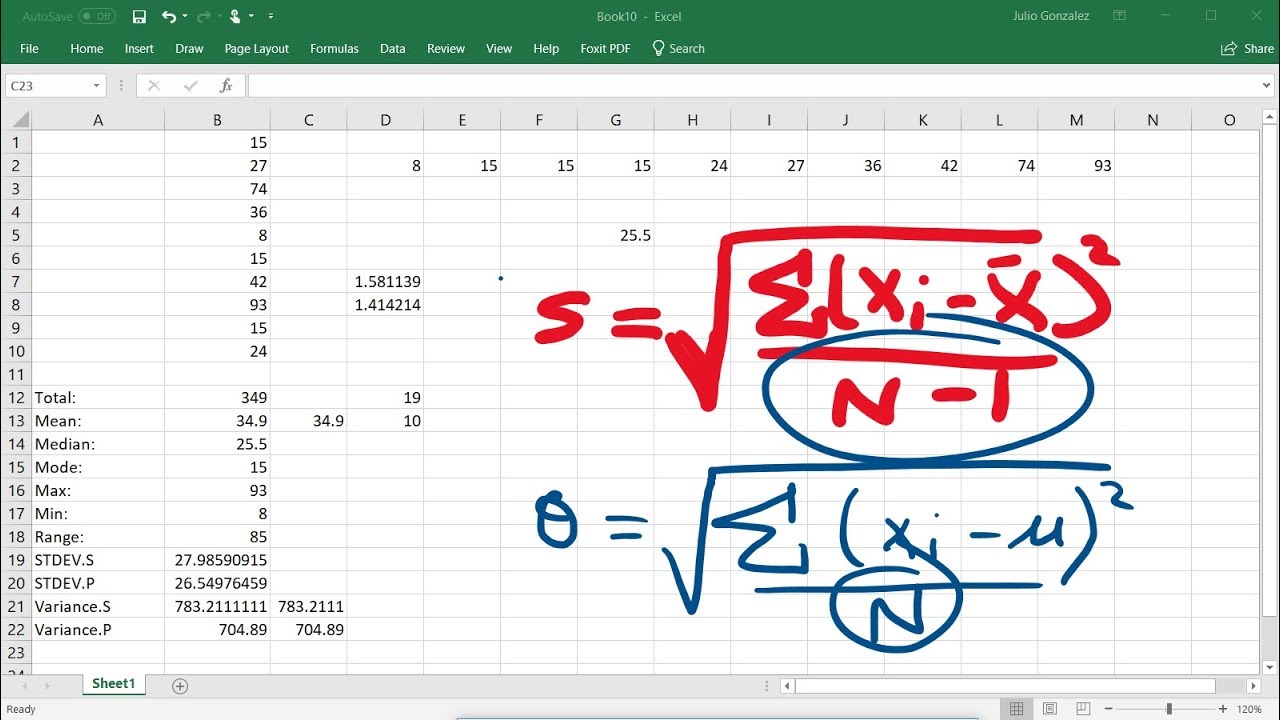
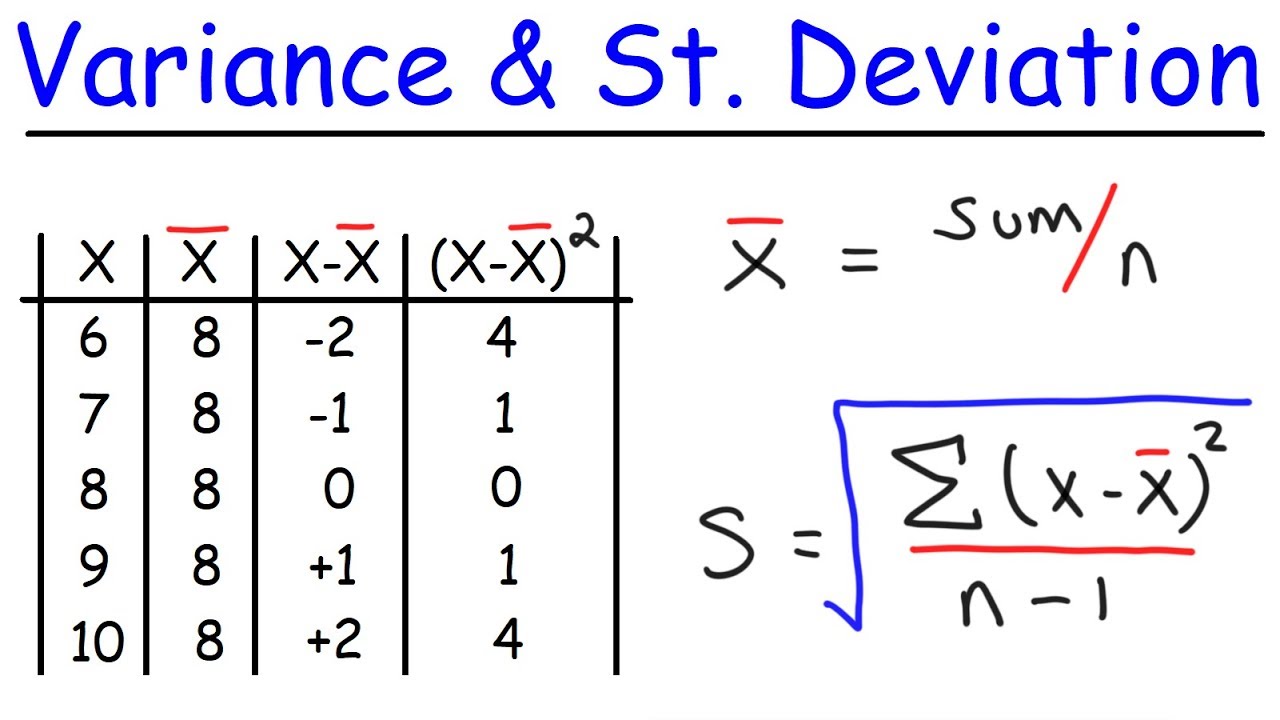
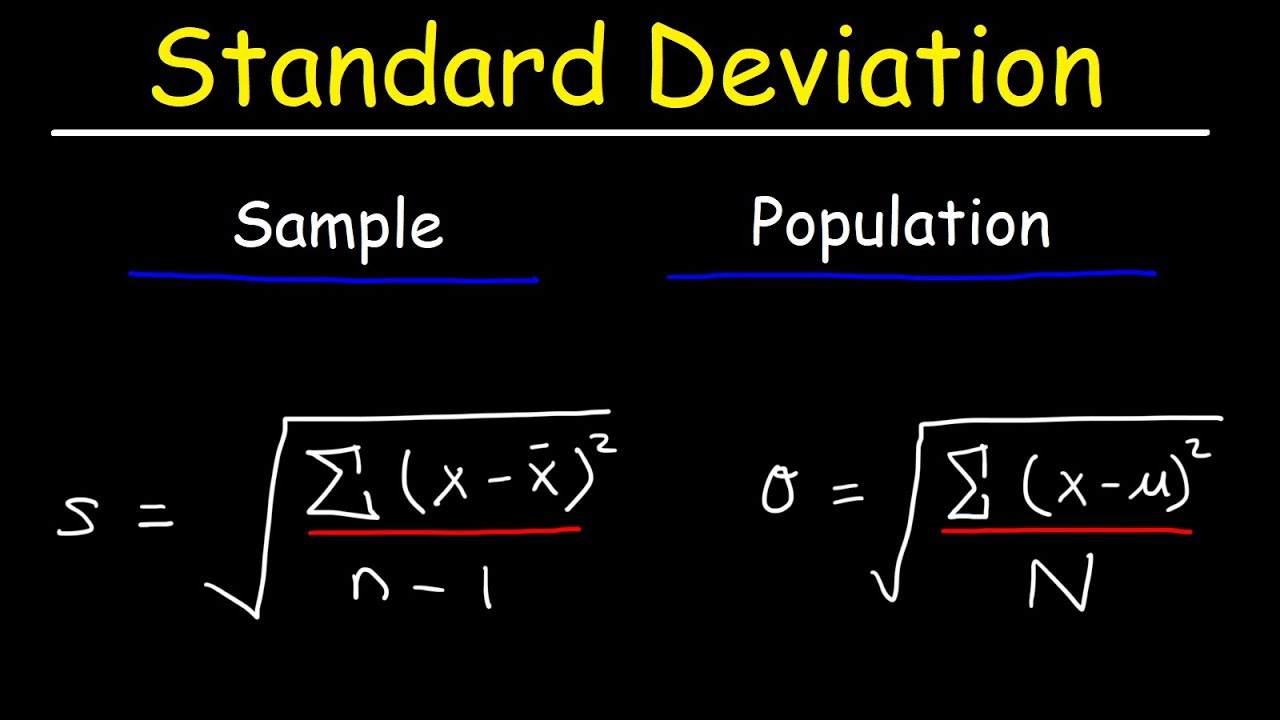
- 📊 **Standard Deviation**: Excel can calculate the standard deviation of a data set, which is useful in statistical analysis.
- 📉 **Variance Calculation**: Excel can also calculate the variance, which is another measure of data spread.
- 📐 **Trigonometric Functions**: Excel can evaluate trigonometric functions, but it requires input in radians for accurate results.
Q & A
How do you perform addition in Excel using cell references?
-To add values from two cells, you can use the formula '=E2 + F2', which will add the values in cells E2 and F2.
What is the formula to subtract two numbers in Excel?
-The formula to subtract two numbers in Excel is '=30 - 18' for direct numbers, or '=F2 - D2' to subtract the value in cell D2 from the value in cell F2.
How do you multiply two numbers using Excel?
-To multiply two numbers, you can use the formula '=8 * 6' for direct numbers, or '=E2 * F2' to multiply the values in cells E2 and F2.
What is the formula to divide 42 by 7 in Excel?
-The formula to divide 42 by 7 in Excel is '=42 / 7', which will give you the result of 6.
How do you calculate the square of a number in Excel?
-To calculate the square of a number, use the formula '=F2^2', which will square the value in cell F2.
What is the Excel function to calculate the square root of a number?
-The Excel function to calculate the square root of a number is '=SQRT(number)', for example, '=SQRT(36)' will give you the square root of 36.
How can you calculate the sum of a group of numbers in a column in Excel?
-To calculate the sum of a group of numbers in a column, you can use the 'SUM' function followed by highlighting the range of numbers, for example, '=SUM(A1:A10)'.
What is the formula to find the average of a range of numbers in Excel?
-To find the average of a range of numbers, you can use the 'AVERAGE' function followed by highlighting the range of numbers, such as '=AVERAGE(A1:A7)'.
How do you find the maximum value in a column of numbers using Excel?
-To find the maximum value in a column, you can use the 'MAX' function followed by the range of cells, for example, '=MAX(A1:A6)'.
What is the Excel function to identify the minimum value in a range of numbers?
-The Excel function to identify the minimum value in a range is 'MIN', used like this: '=MIN(A1:A6)'.
How can you calculate the range of a set of data in Excel?
-To calculate the range of a set of data, subtract the minimum value from the maximum value, which can be done with '=MAX(range) - MIN(range)'.
What is the formula to calculate the sample standard deviation in Excel?
-To calculate the sample standard deviation in Excel, you can use the 'STDEV.S' function followed by the range of numbers, for example, '=STDEV.S(A1:A6)'.
How do you evaluate trigonometric functions like sine or cosine in Excel?
-To evaluate trigonometric functions, you use the function name followed by the angle in radians, like '=SIN(RADIANS(angle))' or '=COS(RADIANS(angle))'. For example, '=SIN(RADIANS(30))' will give you the sine of 30 degrees.
Outlines
📊 Excel Basic Math Functions: Addition, Subtraction, Multiplication, and Division
This paragraph introduces the viewer to basic mathematical operations in Excel. It explains how to perform addition and subtraction by entering numbers directly or referencing cell values. It also covers multiplication, using the 'shift 8' for the multiplication symbol, and division with the backslash. The paragraph concludes with an introduction to exponents, showing how to raise a number to a power and how to use the square root function, including how changes in cell values update calculations.
📈 Advanced Excel Functions: Sum, Average, Max, Min, Range, Standard Deviation, and Variance
The second paragraph delves into more complex functions in Excel, such as calculating the sum and average of a range of numbers. It also teaches how to find the maximum and minimum values in a dataset, as well as how to calculate the range of the data. Additionally, the paragraph covers how to compute the standard deviation and variance for a sample or population, which are crucial for statistical analysis. The speaker also mentions a resource for learning standard deviation calculations on paper and briefly touches on trigonometric functions in Excel, emphasizing the need to input values in radians for accurate results.
📐 Trigonometric Functions in Excel
The final paragraph focuses on the use of trigonometric functions within Excel. It provides examples of how to calculate the sine and cosine of angles, highlighting the importance of using radians for accurate calculations. The paragraph briefly mentions the cosine of 90 degrees and 30 degrees, showing the respective values and emphasizing the precision of Excel in performing these calculations.
Mindmap
Keywords
💡Addition
💡Subtraction
💡Multiplication
💡Division
💡Exponents
💡Square Root
💡Sum
💡Average
💡Maximum
💡Minimum
💡Range
💡Standard Deviation
💡Variance
💡Trigonometric Functions
Highlights
Introduction to basic math functions in Excel for performing calculations.
Direct addition of two numbers in any cell, similar to using a calculator.
Adding values from different cells using the SUM function.
Subtraction of two numbers and using cell references for the operation.
Multiplication of two numbers using the asterisk (*) as the multiplication symbol.
Dividing two numbers with the division symbol (/).
Raising a number to a power using the caret (^) for exponentiation.
Using the square root function to calculate the root of a number.
Automatic recalculation of formulas when cell values change.
Calculating the sum of a group of numbers using the SUM function.
Finding the average of a range of numbers with the AVERAGE function.
Identifying the maximum value in a range with the MAX function.
Determining the minimum value in a range using the MIN function.
Calculating the range of data by subtracting the minimum from the maximum value.
Computing the standard deviation of a population or sample with statistical functions.
Calculating the variance of a dataset with sample or population data.
Evaluating trigonometric functions in degrees by converting to radians within the function.
Excel's utility in simplifying complex statistical and trigonometric calculations.
Transcripts
Browse More Related Video
Calculating The Standard Deviation, Mean, Median, Mode, Range, & Variance Using Excel

Google Sheets Formulas Tutorial: How to Use Formulas and Functions in Google Sheets

Top 30 Excel 2016 Tips, Tricks, Shortcuts, Functions & Formulas
Variance and Standard Deviation With Microsoft Excel - Descriptive Statistics
Standard Deviation Formula, Statistics, Variance, Sample and Population Mean
Calculating Mean, Standard Deviation, Frequencies and More in R | R Tutorial 2.8| MarinStatsLectures
5.0 / 5 (0 votes)
Thanks for rating: