Top 30 Excel 2016 Tips, Tricks, Shortcuts, Functions & Formulas
TLDRThis video tutorial offers an extensive overview of Excel functionalities, covering over 30 features to enhance productivity. It delves into essential tools like autofill, flash fill, shortcut keys for quick operations, data sorting and filtering, and cell freezing for better readability. The tutorial also explores mathematical functions, statistical calculations, and the powerful VLOOKUP function for data retrieval. Additional topics include creating calendars, graphing with trendlines, and utilizing conditional formatting. The script promises to be a comprehensive guide for both novice and intermediate Excel users, aiming to improve their skills and efficiency in data management and analysis.
Takeaways
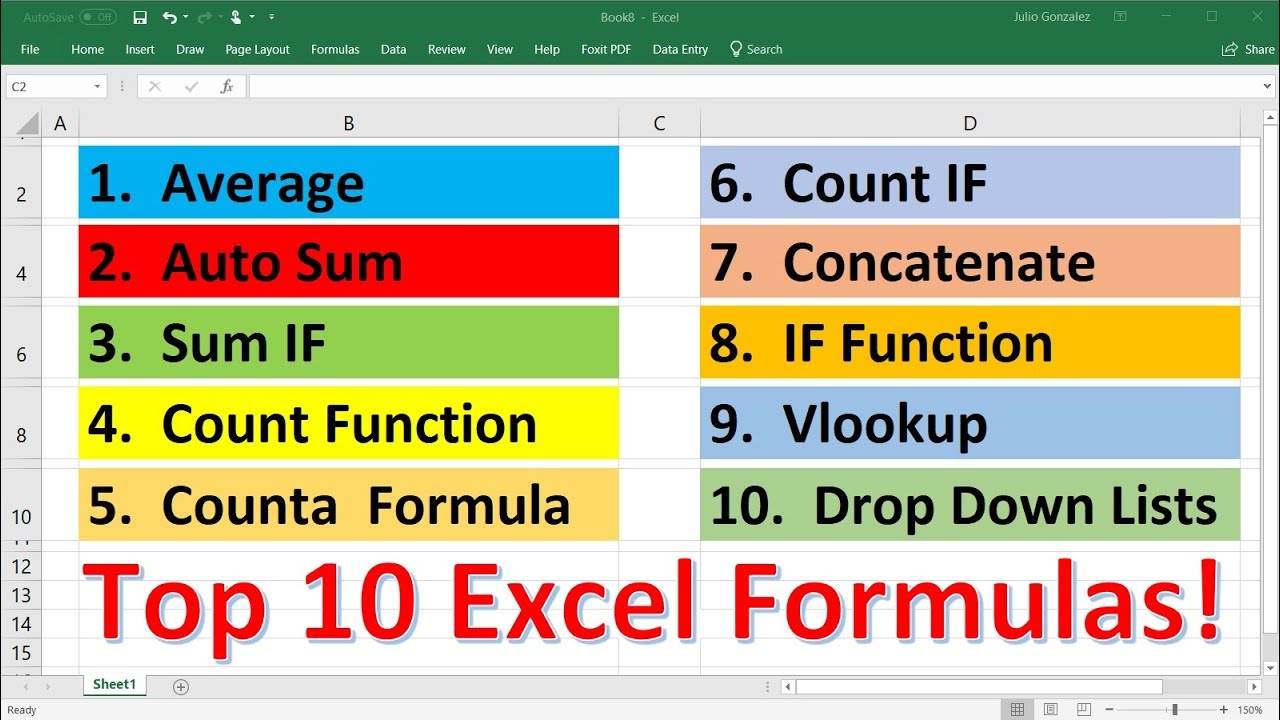
- 🔄 The video covers over 30 functions, formulas, shortcuts, and tips for Excel, including basic operations, data manipulation, and advanced features.
- 📊 Discusses the AutoFill function for extending patterns and sequences, including dates and custom series, as well as Flash Fill for separating data into different columns.
- ⏫ Highlights shortcut keys for quick save (Ctrl + S), quick print (Ctrl + P), and generating a new workbook (Ctrl + N).
- 🔢 Introduces mathematical operations like addition, subtraction, multiplication, and division, and functions for calculating sum, average, and statistical measures like median, mode, range, and standard deviation.
- 🔍 Explains how to use VLOOKUP for searching and retrieving data from a table based on a lookup value.
- 📈 Details on creating graphs and charts, such as line graphs and scatter charts, including displaying equations and using the forecast function for predicting future values.
- 🖌️ Provides tips on formatting text with shortcut keys for bold (Ctrl + B), italicize (Ctrl + I), underline (Ctrl + U), and strikethrough (Ctrl + 5).
- 🔄 Demonstrates how to insert and move rows and columns, as well as Autofit column widths for better readability.
- 🔎 The Find and Replace function is showcased for searching and replacing text within cells.
- ✂️ Describes the Text to Columns feature for splitting text in a single column into multiple columns based on delimiters.
- 📅 Showcases Excel's built-in calendar templates and explains how to create and print custom calendars.
Q & A
What is the purpose of the Autofill function in Excel?
-The Autofill function in Excel is used to automatically fill in cells with data based on identified patterns, such as months in a year, sequential numbers, or names. It can be used to extend patterns horizontally or vertically and can recognize both arithmetic and geometric sequences.
How can Flash Fill in Excel help with separating first and last names in a column?
-Flash Fill in Excel can automatically separate first and last names in a column by recognizing the pattern of data separation. You simply need to type the first instance of the separation (e.g., typing 'John' and 'Smith' in separate columns), and then use the Flash Fill feature to automatically fill the rest of the columns with the separated names.
What is the Quick Save shortcut in Excel?
-The Quick Save shortcut in Excel is Ctrl + S. This keyboard shortcut allows you to quickly save your work without navigating through the menu options.
How can I quickly print my work in Excel?
-To quickly print your work in Excel, you can use the shortcut Ctrl + P. This opens the print dialog box where you can select your printer and print your workbook.
What is the function of the Concatenate function in Excel?
-The Concatenate function in Excel is used to combine text from two or more cells into a single cell. For example, it can be used to merge first and last names from separate cells into a full name in another cell.
Can you explain how to use the Text to Columns feature in Excel?
-The Text to Columns feature in Excel allows you to split data in a single cell into multiple columns. You can select the cells containing the data, go to the Data tab, and choose Text to Columns. Then, you can choose either a delimited or fixed-width separation and follow the prompts to specify the delimiter or column breaks.
How does the Transpose function work in Excel?
-The Transpose function in Excel is used to convert data from a vertical list into a horizontal list, or vice versa. You can copy the data, right-click on the destination cell, select 'Paste Special', and then choose the 'Transpose' option to switch the orientation of the data.
What is the AutoSum function in Excel and how is it used?
-The AutoSum function in Excel is a quick way to calculate the total of a range of cells. You can type '=SUM' followed by the range of cells you want to sum up, and Excel will automatically calculate and display the total.
Can you describe how to create a drop-down list in Excel?
-To create a drop-down list in Excel, you can go to the Data tab and select 'Data Validation'. Under the 'Allow' section, choose 'List' and then either type the values directly in the 'Source' box or use the small button to the right to select a range of cells containing the values for the drop-down list.
How can I find and replace text in Excel?
-To find and replace text in Excel, you can use the Find & Replace feature. Press Ctrl + F to open the Find dialog box, enter the text you want to find, and then click on 'Replace' to open the Replace dialog box. Enter the new text and use 'Replace All' to replace all instances of the found text.
What is Conditional Formatting in Excel and how can it be used?
-Conditional Formatting in Excel is a feature that allows you to apply specific formats to cells based on certain conditions. For example, you can highlight cells that are greater than a certain value, use data bars or color scales, or format the top or bottom values in a range. This helps in visualizing data trends and insights.
How can Excel be used to create graphs and find trend lines?
-Excel can be used to create various types of graphs, such as scatter charts, by selecting the data and choosing the appropriate chart type from the Insert tab. To find a trend line, you can add a trend line to the graph, display the equation on the chart, and use the SLOPE and INTERCEPT functions to calculate the slope and y-intercept of the line.
What is the Forecast function in Excel and how is it used?
-The Forecast function in Excel is used to predict future values based on existing data. It works well with linear trends. You can use the function by inputting the future x-value and the known y-values and x-values from your data set, and it will return the predicted y-value for that x-value.
Outlines
📊 Overview of Excel Functions and Features
This video covers at least 30 functions, formulas, shortcuts, and tips for Excel. It introduces autofill, flash fill, shortcut keys, sorting and filtering data, mathematical operations, and statistical functions like median and mode. The section also mentions creating charts, using forecast functions, and more.
🖱️ Using the Autofill Function
Autofill allows users to quickly fill cells with repetitive or sequential data such as months, names, or patterns. The section explains how to extend patterns for numbers and dates, and how to create arithmetic and geometric sequences.
⚡ Flash Fill for Data Manipulation
Flash Fill helps split or combine data across columns. By typing in examples, Excel can automatically fill in the rest. The section provides examples of separating full names into first and last names and using flash fill to automate the process.
💾 Quick Save, Print, and Workbook Creation
Describes quick save (Ctrl+S), quick print (Ctrl+P), and creating new workbooks (Ctrl+N). It also covers how to add new sheets and use shortcuts to streamline these processes.
🔗 Using the Concatenate Function
Combining text from multiple columns into one using the CONCATENATE and TEXTJOIN functions. The section demonstrates how to join first and last names into a single column and includes the use of delimiters like spaces.
📑 Text to Column Feature
Explains how to split data from one column into multiple columns using delimiters or fixed width. Examples include splitting names with spaces and separating parts of a string into different columns.
🔄 The Transpose Function
Converting vertical data into horizontal data and vice versa using the transpose function. It shows how to transpose single columns as well as multiple columns of data.
🔤 Sorting Data
Sorting data alphabetically or numerically. Demonstrates sorting a list of names while keeping related data intact and sorting a list of numbers from largest to smallest.
🔎 Filtering Data
Creating filters to display specific data within a table. Examples include filtering by text, numbers within a range, and using the table format to manage filter options efficiently.
❄️ Freezing Rows and Columns
Keeping specific rows and columns visible while scrolling through a worksheet. The section covers freezing the top row, the first column, and combinations of rows and columns.
🧩 Extracting Text from Cells
Using LEFT, MID, and RIGHT functions to extract specific parts of a text string. Examples include splitting item numbers into location codes, manufacturer codes, and sizes.
➕ AutoSum Function
Calculating the sum of a range of cells using the AutoSum function. Demonstrates simple addition, adding multiple numbers, and other ways to sum data using formulas.
📈 Calculating Averages
Finding the average of a data set using the AVERAGE function. Shows how to calculate averages for a range of cells and specific sets of numbers.
🔢 Using the COUNT Functions
Different COUNT functions: COUNT (counts cells with numbers), COUNTA (counts non-empty cells), and COUNTBLANK (counts empty cells). Examples illustrate how to use these functions with various types of data.
🔢 Basic Mathematical Operations
Performing basic math operations (addition, subtraction, multiplication, division) in Excel. Examples show how to use these operations within cells and extend patterns for multiple calculations.
📊 Max and Min Functions
Finding the maximum and minimum values in a range using the MAX and MIN functions. Also covers calculating the range, median, mode, and standard deviation for statistical analysis.
🔢 Advanced Statistical Functions
Using MEDIAN, MODE, and STDEV functions for statistical analysis. Examples include finding median values, mode (most frequent value), and standard deviation for a sample set of data.
📊 Showing Formulas
Displaying formulas in cells to see how calculations are made. Explains using the Show Formulas button and the keyboard shortcut (Ctrl+Tilde) to toggle between formula view and result view.
🔎 VLOOKUP Function
Using VLOOKUP to search for and retrieve data from a table based on a specific value. Examples include looking up sales data, email addresses, phone numbers, and ages for sales agents.
📋 Creating a Drop-Down List
Creating drop-down lists for data entry using Data Validation. Demonstrates how to set up a list of names that can be selected from a drop-down menu.
⌨️ Shortcut Keys
Common Excel shortcut keys for formatting and navigation. Examples include bolding text (Ctrl+B), italicizing (Ctrl+I), underlining (Ctrl+U), and creating strikethroughs (Ctrl+5).
🔀 Inserting Line Breaks
Inserting line breaks within a cell to display text on multiple lines. The section shows using Alt+Enter to create line breaks in a cell.
📏 AutoFit Column Width
Automatically adjusting the width of columns to fit the content. The section demonstrates selecting columns and using the AutoFit feature to resize them.
➕ Inserting Rows and Columns
Inserting new rows and columns into a worksheet. Shows how to right-click to insert columns and rows, and how to move rows and columns using the Shift key.
🔀 Moving Rows and Columns
Moving rows and columns within a worksheet. Demonstrates selecting rows or columns, holding the Shift key, and dragging to move them to a new location.
🔍 Find and Replace
Using the Find and Replace functions to search for and replace text within a worksheet. Shows how to find specific text and replace it with new text.
🔠 Changing Case
Changing text case using LOWER, UPPER, and PROPER functions. Examples include converting text to lowercase, uppercase, and capitalizing the first letter of each word.
📅 Creating Excel Calendars
Using pre-made calendar templates in Excel. Explains how to access and customize calendar templates, and how to print them.
✨ Conditional Formatting
Applying conditional formatting to cells based on their values. Shows how to highlight cells with specific criteria, use data bars, color scales, and create custom formatting rules.
📈 Creating Excel Graphs
Creating scatter charts and displaying trendline equations. Explains how to select data, insert a scatter chart, add trendlines, and display equations on the chart. Also covers calculating slope and intercept using functions.
Mindmap
Keywords
💡Autofill Function
💡Flash Fill
💡Shortcut Keys
💡Data Sorting
💡Filtering Data
💡Freeze Rows and Columns
💡Concatenate Function
💡Text to Column
💡Transpose Function
💡Autosum Function
💡VLOOKUP Function
💡Conditional Formatting
💡Excel Graphs
Highlights
Introduction to over 30 Excel functions, formulas, shortcuts, and tips for efficient data handling.
Explanation of the Autofill function for extending months, names, numbers, and sequences.
How to use Flash Fill to separate first and last names from a single column into two.
Quick save and print shortcuts (Ctrl + S and Ctrl + P) for efficient workflow.
Creating new workbooks and sheets using shortcut keys for speed.
Concatenate function to combine information from two columns into one.
Text to Columns feature for splitting data into separate columns based on delimiters.
Transpose function to convert vertical data into horizontal and vice versa.
Sorting data alphabetically or numerically and keeping data sets aligned.
Filtering data using tables to display specific subsets of information.
Freezing rows and columns to keep them visible while scrolling through data.
Using LEFT, MID, and RIGHT functions to extract specific parts of text within cells.
AutoSum function for quickly calculating the sum of a range of cells.
Basic mathematical operations like addition, subtraction, multiplication, and division.
Max and Min functions for finding the highest and lowest values in a range.
COUNT, COUNTA, and COUNTBLANK functions for various counting needs in data sets.
VLOOKUP function to retrieve data from a table based on a lookup value.
Creating drop-down lists for data selection to streamline data entry.
Shortcut keys for text formatting such as bold (Ctrl + B), italicize (Ctrl + I), underline (Ctrl + U), and strikethrough (Ctrl + 5).
Inserting line breaks within a cell using Alt + Enter for creative cell formatting.
Autofit Column Width for adjusting column widths to fit content.
Inserting and moving rows and columns for data organization.
Using Find and Replace for efficient text searching and editing within worksheets.
Changing text case using LOWERCASE, UPPERCASE, and PROPER functions.
Excel Calendars feature for quickly printing pre-made calendars.
Conditional Formatting for highlighting cells based on specific criteria.
Creating scatter charts with trendlines and equations for data analysis.
Using SLOPE and INTERCEPT functions to calculate linear regression parameters.
FORECAST function for predicting future values based on existing data trends.
Transcripts


5.0 / 5 (0 votes)
Thanks for rating: