What are p-values?? Seriously.
TLDRIn this informative video, Justin Zeltzer explores the concept of p-values, using the analogy of a coin flip to illustrate their intuition. He explains the difference between one-tailed and two-tailed p-values and their significance in hypothesis testing. The historical context of p-values is also discussed, from John Arbuthnot's 18th-century observations to the formal definition by Ronald Fisher. The video concludes with a practical example from a medical study, demonstrating how p-values are used to compare groups and assess the significance of outcomes.
Takeaways
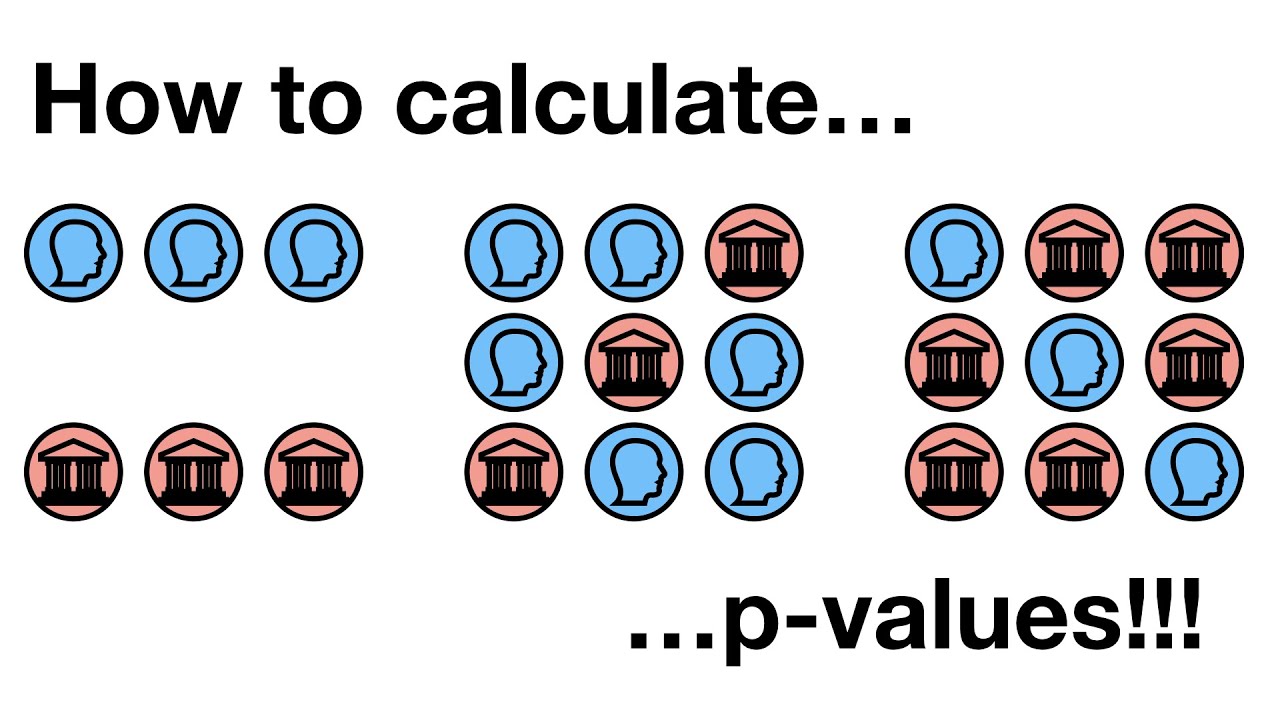
- 🎲 The concept of p-values is intuitively understood through the example of flipping a coin and expecting a fair distribution of outcomes.
- 📈 P-values measure the probability of obtaining a sample as or more extreme than the observed results, given a null hypothesis is true.
- 🔍 The null hypothesis is a default position in statistics that assumes no effect or difference, which is tested against evidence.
- 📊 A two-tailed p-value accounts for extreme results in both directions from the expected outcome, whereas a one-tailed p-value considers only one direction.
- 🤔 The history of p-values dates back to 1710, with John Arbuthnot's analysis of male and female birth rates, which was an early use of probability to test a hypothesis.
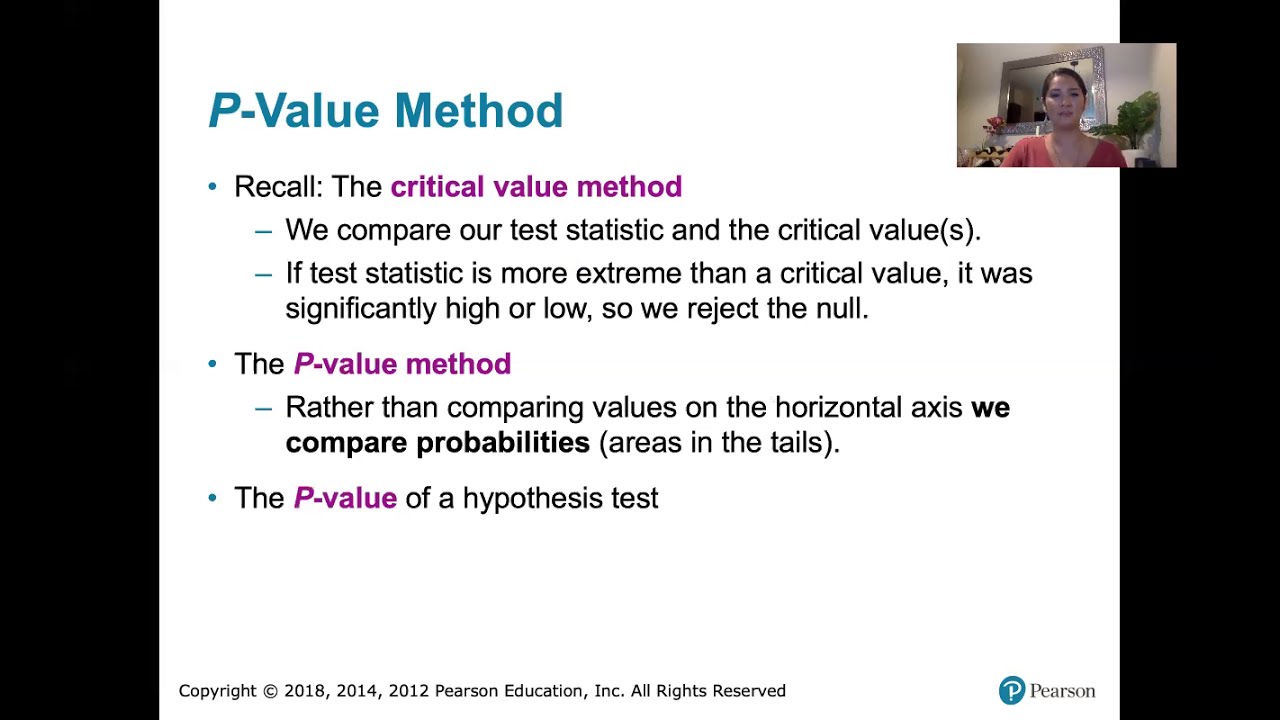
- 📜 Simeon Poisson's work in the 1830s introduced the idea of a critical value for p-values, which would later be formalized by Ronald Fisher.
- 🌟 Ronald Fisher in 1925 defined the p-value and established the 0.05 threshold for statistical significance.
- 🔢 The p-value calculation involves comparing the observed sample to the distribution of possible outcomes under the null hypothesis.
- 🧐 A low p-value (typically below 0.05) suggests that the observed results are unlikely under the null hypothesis, leading to its rejection.
- 📊 In research, p-values are used to compare groups and assess the significance of differences in outcomes, with lower p-values indicating greater significance.
- 📈 The interpretation of p-values depends on the context, such as whether the research aims to show no difference (high p-value) or a significant effect (low p-value).
Q & A
What is the main concept discussed in the video?
-The main concept discussed in the video is p-values, their intuition, history, and how they are used in statistical analysis, particularly in the context of hypothesis testing.
How does the Australian two-dollar coin example illustrate the intuition behind p-values?
-The Australian two-dollar coin example demonstrates the intuition behind p-values by asking viewers to predict the number of heads they would expect from flipping the coin 100 times. The discussion around the likelihood of getting 90 heads out of 100 flips introduces the concept of how extreme a sample result is under the null hypothesis, which is the basis of p-value calculation.
What is the null hypothesis in the context of the coin flip example?
-In the context of the coin flip example, the null hypothesis is that the coin is fair, meaning that there is an equal probability of getting heads or tails, and thus we would expect to get approximately 50 heads out of 100 flips.
How are one-tailed and two-tailed p-values different?
-One-tailed p-values are used when the alternative hypothesis is directional, meaning we are interested in a difference in one direction only. Two-tailed p-values are used when the alternative hypothesis is non-directional, meaning we are interested in any difference, regardless of the direction.
What is the significance of a p-value of 0.05 in statistical analysis?
-A p-value of 0.05 is often used as a critical threshold in statistical analysis. If the p-value is less than 0.05, it suggests that the observed result is unlikely to have occurred by chance alone, leading to the rejection of the null hypothesis.
How did the concept of p-values originate?
-The concept of p-values originated from John Arbuthnot's paper in 1710, where he analyzed birth data and concluded that the probability of male babies being more numerous for 82 years in a row was extremely small, thus suggesting divine providence.
What is the role of the binomial distribution in understanding p-values?
-The binomial distribution is used to understand the probability of getting a certain number of heads (or tails) in a series of coin flips, which is directly related to calculating p-values in hypothesis testing involving binary outcomes.
What does the video suggest about the relationship between the sample size and the p-value?
-The video suggests that the sample size can affect the p-value. For example, getting 56 heads out of 100 flips results in a p-value of 0.193, which is not alarming, but as the number of heads increases, such as in the case of 90 heads out of 100 flips, the p-value becomes much smaller, indicating a more significant result.
How does the video illustrate the concept of a more extreme sample result?
-The video illustrates the concept of a more extreme sample result by showing that a more extreme result is one that is further away from the expected value under the null hypothesis. For instance, getting 90 heads out of 100 flips is considered more extreme than getting 56 heads because it is further from the expected 50 heads.
What is the practical implication of a p-value in research studies?
-In research studies, a p-value helps determine the likelihood that the observed results are due to chance alone. A low p-value suggests that the observed effects are unlikely to be due to random chance, thus providing evidence in favor of the alternative hypothesis and potentially leading to the rejection of the null hypothesis.
How does the video use the concept of p-values to analyze a research study on epilepsy management with a smartphone application?
-The video uses the concept of p-values to analyze the differences between the baseline characteristics of the participants and the outcomes of the epilepsy management study. High p-values indicate that there is no significant difference between the groups in terms of baseline characteristics, while low p-values suggest that there is a significant difference in the outcomes between the groups, supporting the effectiveness of the smartphone application in managing epilepsy episodes.
Outlines
🎲 Intuition Behind P-Values
The paragraph introduces the concept of p-values using the analogy of flipping a coin. It explains that the intuition required to understand p-values is already present in people, as demonstrated by their reactions to the outcome of 100 coin flips. The speaker, Justin Zeltzer, uses the example of flipping 90 heads out of 100 times to show that such an extreme outcome would lead people to question the fairness of the coin. This is similar to how p-values are used in statistics to determine the likelihood of observing sample results under the null hypothesis, which is the default position that there is no effect or difference.
📊 Understanding P-Values and Null Hypothesis
This paragraph delves deeper into the definition and calculation of p-values. It explains that a p-value is the probability of obtaining a sample as extreme as, or more extreme than, the observed sample under the null hypothesis. The example continues with the coin flip scenario, illustrating how a sample of 56 heads out of 100 would have a p-value of 0.193, or 19.3%, if the coin was fair. The paragraph also introduces the concept of a two-tailed p-value, which considers both directions of deviation from the expected value (e.g., more than 56 heads or fewer than 44 heads).
📈 Historical Context of P-Values
The paragraph discusses the historical development of p-values, tracing back to 1710 when John Arbuthnot noticed a higher male birth rate than female over 82 years. Although Arbuthnot did not use the term p-value, his work is seen as an early application of the concept. The paragraph then moves to the 19th century, discussing the work of Simeon Poisson and Ronald Fisher, who further developed the concept of p-values and established the 0.05 threshold for statistical significance.
🔍 Differences Between One-Tailed and Two-Tailed P-Values
This section explains the difference between one-tailed and two-tailed p-values. It describes that a two-tailed p-value considers both directions of deviation from the null hypothesis (e.g., more or fewer heads than expected), while a one-tailed p-value focuses on one direction only (e.g., only more heads or only fewer tails). The paragraph provides examples of scenarios where each type of p-value would be used, emphasizing that the choice between one-tailed and two-tailed p-values depends on the nature of the research question and whether the direction of the effect is of interest.
📝 Analyzing Research Using P-Values
The paragraph presents a practical example of how p-values are used in research, specifically in a study published in the Medical Journal of Australia about epilepsy management using a smartphone application. It explains how p-values are used to compare baseline characteristics between groups to ensure they are similar and to analyze outcome differences between the groups. The paragraph highlights the significance of low p-values in indicating a true difference between groups and how high p-values confirm that baseline characteristics are not significantly different.
🚀 Conclusion and Call to Action
In the concluding paragraph, the speaker summarizes the main points discussed in the video and encourages viewers to share the content if they found it informative. Justin Zeltzer invites viewers to subscribe, like, and comment on the video to support the growth of the channel and enable the creation of more educational content. He also directs viewers to his website for access to other videos in the series.
Mindmap
Keywords
💡p-values
💡null hypothesis
💡alternative hypothesis
💡coin flip
💡statistical significance
💡one-tailed and two-tailed p-values
💡binomial distribution
💡critical value
💡sample size
💡randomness
💡health statistics
💡epidemiology
Highlights
The video introduces the concept of p-values using an intuitive coin flip example.
The Australian two-dollar coin is used to demonstrate the concept of p-values.
The video explains that getting 90 heads out of 100 flips would raise suspicions about the fairness of the coin.
P-values measure the probability of obtaining a sample as extreme as, or more extreme than, the observed results under the null hypothesis.
The video delves into the history of p-values, tracing back to 1710 with John Arbuthnot's observation of male births exceeding female births.
Simeon Poisson's work in 1837 introduced the idea of a critical value for p-values.
Ronald Fisher in 1925 defined the p-value and established 0.05 as the threshold for statistical significance.
The video clarifies the difference between one-tailed and two-tailed p-values, emphasizing their application based on the research hypothesis.
Two-tailed p-values are used when the research question allows for effects in either direction.
One-tailed p-values are used when the research question specifies a direction of effect.
The video uses examples of medical research to illustrate the application of p-values in comparing groups and assessing outcomes.
High p-values (above 0.05) indicate that observed differences between groups are likely due to chance.
Low p-values (below 0.05) suggest that observed differences are statistically significant and not likely due to chance.
The video discusses a study on epilepsy management using a smartphone application, showing how p-values are used in practical research.
The study found significant differences in epilepsy outcomes between the group using a smartphone app and the control group.
The video emphasizes the importance of understanding p-values in research interpretation.
The video concludes by encouraging viewers to share the content and subscribe for more educational videos on statistics.
Transcripts
Browse More Related Video
How to calculate p-values

t-Test - Full Course - Everything you need to know

One-tailed and two-tailed tests | Inferential statistics | Probability and Statistics | Khan Academy

Elementary Stats Lesson #18

p-values: What they are and how to interpret them
8.1.5 Basics of Hypothesis Testing - P-value Method, and Comparison to the Critical Value Method
5.0 / 5 (0 votes)
Thanks for rating: