Y1 8) Consumer and Producer Surplus
TLDRThis video provides a detailed explanation of welfare analysis in economics, focusing on consumer and producer surplus. It defines consumer surplus as the difference between what consumers are willing to pay and what they actually pay, and producer surplus as the difference between the price producers are willing to accept and what they receive. The video illustrates these concepts using diagrams, showing how changes in price affect surpluses. It also covers the overall societal surplus, which is the sum of consumer and producer surpluses, and how shifts in supply and demand impact these surpluses.
Takeaways
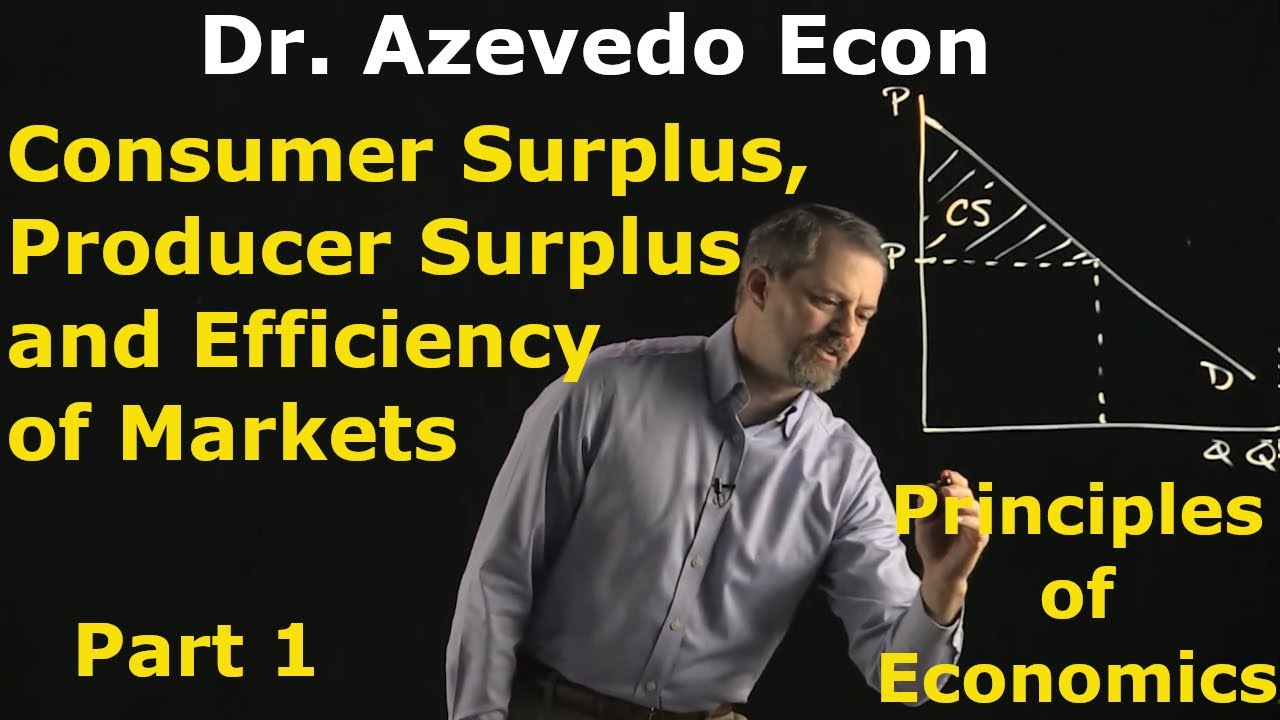
- 📈 Consumer surplus is the difference between what consumers are willing to pay and what they actually pay for a good or service, typically represented as a triangle below the demand curve and above the price line.
- 📉 Producer surplus is the difference between what producers are willing to supply a good or service for and the price they actually receive, usually depicted as a triangle above the supply curve and below the price line.
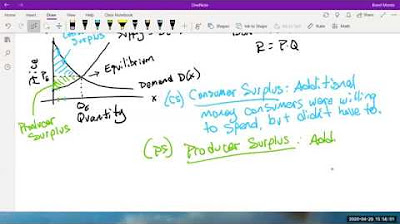
- 🔍 To find consumer surplus on a diagram, calculate the area beneath the demand curve and above the price line.
- 📏 Similarly, to find producer surplus, calculate the area above the supply curve and beneath the price line.
- ↗️ When the price increases from p1 to p2, consumer surplus decreases, as fewer consumers are willing to pay the higher price, resulting in a smaller surplus area.
- ↙️ Conversely, when the price decreases to p3, consumer surplus increases, as more consumers are willing to buy at the lower price, expanding the surplus area.
- 🔼 An increase in price to p2 also increases producer surplus, as suppliers are willing to sell at a higher price, expanding the surplus area above the supply curve.
- 🔽 A decrease in price to p3 reduces producer surplus, as suppliers are now selling at a lower price, resulting in a smaller surplus area.
- 🌐 Society's surplus, or total welfare, is the sum of consumer and producer surplus, representing the overall efficiency of resource allocation.
- 🔄 Shifts in supply or demand curves will affect both consumer and producer surplus, with leftward supply shifts typically reducing consumer surplus and rightward demand shifts increasing producer surplus.
- 📚 It's important to note that while consumer and producer surplus are often triangular, they can sometimes be trapezoidal in more complex economic scenarios.
Q & A
What is the definition of consumer surplus?
-Consumer surplus is the difference between the price consumers are willing and able to pay for a good or service and the price that they actually pay.
How is consumer surplus typically represented on a diagram?
-Consumer surplus is usually represented as a triangle-shaped area found below the demand curve and above the price line on a diagram.
What happens to consumer surplus when the price of a good increases from p1 to p2?
-When the price increases from p1 to p2, consumer surplus falls because fewer consumers are willing and able to pay the higher price, resulting in a smaller area between the demand curve and the new price line.
How can we find the area of consumer surplus on a diagram?
-The area of consumer surplus can be found by calculating the area beneath the demand curve and above the price line, which typically forms a triangular shape.
What is the definition of producer surplus?
-Producer surplus is the difference between the price producers are willing and able to supply a good or service for and the price that they actually receive.
How is producer surplus typically represented on a supply and demand diagram?
-Producer surplus is usually represented as a triangle-shaped area found above the supply curve and below the price line on a supply and demand diagram.
What happens to producer surplus when the price of a good decreases from p1 to p3?
-When the price decreases from p1 to p3, producer surplus falls because producers are now selling their goods at a lower price than they were initially willing to accept.
How can we calculate the area of producer surplus on a diagram?
-The area of producer surplus can be calculated by determining the area above the supply curve and beneath the price line, which typically forms a triangular shape.
What is meant by society's surplus in economics?
-Society's surplus in economics refers to the sum of consumer and producer surplus, representing the total welfare gained from the allocation of resources in a market.
How does a shift in the supply curve to the left affect consumer surplus?
-A leftward shift in the supply curve leads to a new equilibrium with a higher price and lower quantity, resulting in a decrease in consumer surplus due to fewer consumers being able to purchase the good at the higher price.
How does a rightward shift in the demand curve affect producer surplus?
-A rightward shift in the demand curve results in a new equilibrium with a higher price and quantity, leading to an increase in producer surplus as producers are now able to sell more goods at a higher price.
What is a rare case where consumer and producer surplus might not form a triangle on a diagram?
-In rare cases, consumer and producer surplus might form a trapezium rather than a triangle on a diagram, which can occur in specific economic proofs or scenarios.
Outlines
📈 Understanding Consumer and Producer Surplus
This paragraph introduces the fundamental concepts of consumer and producer surplus in economics, which are crucial for analyzing the efficiency of resource allocation. Consumer surplus is defined as the difference between what consumers are willing to pay and what they actually pay, typically represented as a triangle below the demand curve and above the price line on a diagram. The paragraph explains how to calculate consumer surplus graphically by identifying the area between the demand curve and the price line. Similarly, producer surplus is the difference between the price producers are willing to accept and the actual price received, usually depicted as a triangle above the supply curve and below the price line. The paragraph also illustrates how to calculate producer surplus on a diagram and discusses how changes in price affect both consumer and producer surplus.
🔍 Shifts in Supply and Demand and Their Impact on Surplus
The second paragraph delves into how shifts in supply and demand curves impact consumer and producer surplus. It explains that a leftward shift in the supply curve leads to a new equilibrium with higher prices and lower quantities, resulting in a decrease in consumer surplus. The calculation of this new surplus is demonstrated using the area beneath the demand curve and above the new price line. Conversely, a rightward shift in the demand curve, which results in a higher price and quantity at the new equilibrium, increases producer surplus. The paragraph shows how to calculate the new producer surplus by identifying the area above the supply curve and below the new price line. It also emphasizes that while consumer and producer surpluses are typically triangular, they can sometimes take other shapes, such as trapezoids, in specific economic proofs.
Mindmap
Keywords
💡Welfare Analysis
💡Consumer Surplus
💡Producer Surplus
💡Demand Curve
💡Supply Curve
💡Equilibrium
💡Scarce Resources
💡Shifts in Supply and Demand
💡Economic Efficiency
💡Market
💡Society's Surplus
Highlights
Welfare analysis is crucial in economics for understanding resource allocation efficiency.
Consumer surplus is the difference between the price consumers are willing to pay and the actual price paid.
Consumer surplus is typically represented as a triangle below the demand curve and above the price line.
Producer surplus is the difference between the price producers receive and the price they are willing to supply at.
Producer surplus is usually a triangle above the supply curve and below the price line.
Changes in price affect both consumer and producer surplus, with higher prices generally reducing consumer surplus and increasing producer surplus.
Consumer surplus can be calculated as the area between the demand curve and the price line.
Producer surplus can be found by calculating the area between the supply curve and the price line.
In a market diagram, consumer and producer surplus can be illustrated at equilibrium where demand equals supply.
Society's surplus is the sum of consumer and producer surplus, representing the total welfare in the market.
Shifts in supply can lead to changes in consumer surplus, with a leftward shift typically reducing it.
Demand shifts to the right can increase producer surplus, as seen in the new equilibrium with higher prices and quantities.
The shapes of consumer and producer surplus are generally triangles but can sometimes be trapezoids in specific cases.
Understanding consumer and producer surplus is essential for analyzing the allocation of scarce resources.
Diagrams provide a simple and effective way to visualize changes in consumer and producer surplus due to price fluctuations.
The video concludes by emphasizing the importance of mastering the concepts of consumer and producer surplus for economic analysis.
Transcripts
Browse More Related Video

What is Consumers Surplus and Producer Surplus?
Chapter 7: Consumer Surplus, Producer Surplus and the Efficiency of Markets - Part 1

Consumer Surplus and Producer Surplus
Math 11 - Section 5.1

Consumer Surplus | Numericals on Consumer Surplus | Mathematical Economics | Ecoholics
Total consumer surplus as area | Microeconomics | Khan Academy
5.0 / 5 (0 votes)
Thanks for rating: