Social Benefit of Trade (Gains from Trade)
TLDRIn this video, the concept of total social benefit of trade, also known as gains from trade, is explained through an example. The video begins by illustrating the equilibrium point where the supply and demand curves intersect, representing a balance between what consumers are willing to buy and what producers are willing to sell at a given price. The consumer surplus, the area below the demand curve and above the equilibrium price, and the producer surplus, the area above the supply curve and below the equilibrium price, are identified as the positive outcomes for both parties. The total social benefit is calculated by integrating the area between the demand and supply curves from zero to the equilibrium quantity. The example provided walks through the process of finding the equilibrium point, calculating the consumer and producer surplus, and finally determining the social benefits of trade using integration. The result of the example is a total gain from trade of 4, demonstrating the economic value of trade.
Takeaways
- 📈 The concept of total social benefit of trade, also known as gains from trade, is explained through the intersection of the demand and supply curves on a graph.
- 🔵 The demand curve is represented as a downward sloping line, indicating that as price decreases, the quantity demanded increases.
- 🔴 The supply curve is an upward sloping line, showing that as the price increases, the quantity supplied also increases.
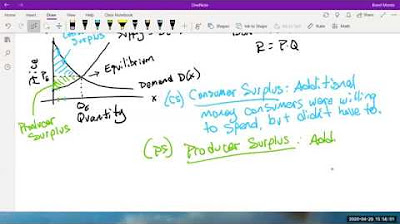
- ⚖️ The equilibrium point is where the demand and supply curves intersect, indicating a balance where the quantity demanded equals the quantity supplied at the equilibrium price.
- 💰 Consumer surplus is the area below the demand curve and above the equilibrium price line, representing the savings consumers make compared to what they were willing to pay.
- 🏭 Producer surplus is the area above the supply curve and below the equilibrium price line, indicating the additional revenue producers earn beyond what they were willing to accept.
- 🤝 Combining consumer and producer surplus gives us the total social benefit of trade, which is a positive outcome for society as a whole.
- 📐 The formula for calculating the social benefit of trade is an integral from 0 to the equilibrium quantity (q) of the difference between the demand and supply curves.
- 📊 The area between the demand and supply curves from zero to q represents the total gains from trade, which is the sum of consumer and producer surplus.
- 🧮 An example is provided to illustrate how to calculate the social benefit of trade by integrating the difference between the demand and supply curves from 0 to q.
- 📐 The equilibrium quantity (q) and price (p) are identified as the point where the demand and supply curves cross, which in the example is (1, 9).
- ✅ The total gains from trade are calculated by evaluating the definite integral from 0 to q, which in the example results in a total gain of 4.
Q & A
What is the concept of 'total social benefit of trade' explained in the video?
-The total social benefit of trade, also known as gains from trade, refers to the combined benefits that arise from trade which includes both consumer surplus and producer surplus. It is represented by the area between the demand and supply curves up to the equilibrium quantity.
How is the equilibrium point in a market determined?
-The equilibrium point is determined where the demand curve and the supply curve intersect on the same set of axes. At this point, the quantity that consumers demand is exactly equal to the quantity that producers are willing to supply at the equilibrium price.
What is consumer surplus and how is it represented on a graph?
-Consumer surplus is the difference between how much consumers are willing to pay and how much they actually pay. It is represented on a graph by the area below the demand curve and above the equilibrium price line.
What is producer surplus and how is it represented on a graph?
-Producer surplus is the difference between how much producers are willing to accept and how much they actually receive. It is represented on a graph by the area above the supply curve and below the equilibrium price line.
What is the formula used to calculate the social benefit of trade in the video?
-The formula used to calculate the social benefit of trade is the integral from 0 to q of the demand curve minus the supply curve, which represents the area between these two curves up to the equilibrium quantity.
How does the video illustrate the process of finding the social benefits of trade?
-The video illustrates this by first identifying the equilibrium point where the demand and supply curves intersect. It then sets up an integral using the demand and supply equations, evaluates the integral from zero to the equilibrium quantity, and calculates the resulting area to find the social benefits of trade.
What are the coordinates of the equilibrium point found in the example provided in the video?
-The equilibrium point in the example has the coordinates (1, 9), indicating a quantity of 1 and a price of 9.
How is the consumer surplus calculated in the example provided?
-The consumer surplus is calculated by integrating the demand curve, which is 12 - 3q^2, from 0 to the equilibrium quantity, q=1, and then subtracting the area under the price line at the equilibrium price.
How is the producer surplus calculated in the example provided?
-The producer surplus is calculated by integrating the supply curve, which is 4q + 5, from 0 to the equilibrium quantity, q=1, and then subtracting the area under the price line at the equilibrium price.
What is the total gains from trade calculated in the example provided in the video?
-The total gains from trade in the example is calculated to be 4, which is the sum of the consumer surplus and producer surplus at the equilibrium point.
What tool is suggested for evaluating the integral to find the total gains from trade?
-The video suggests using a mathematical tool like Desmos to evaluate the integral and find the antiderivative, which can then be used to calculate the total gains from trade.
Why is it important to consider both consumer and producer surplus when calculating the total social benefit of trade?
-Considering both consumer and producer surplus is important because it provides a comprehensive view of the welfare gains from trade. It accounts for the benefits to both parties involved in the transaction, reflecting the overall efficiency and desirability of the trade.
Outlines
📈 Understanding Equilibrium and Gains from Trade
This paragraph introduces the concept of total social benefit of trade, also known as gains from trade, in the context of economic theory. It explains the graphical representation of demand and supply curves and how they intersect at the equilibrium point, where the quantity demanded by consumers equals the quantity supplied by producers at the equilibrium price. The paragraph also discusses the calculation of consumer surplus and producer surplus, which are the benefits accruing to consumers and producers, respectively, due to trade. The total social benefit is then defined as the sum of these two surpluses. An integral formula is provided to calculate the social benefit of trade, which is essentially the area between the demand and supply curves up to the equilibrium quantity.
🧮 Calculating Social Benefits of Trade with an Example
The second paragraph delves into an example to illustrate how to determine the equilibrium point and calculate the gains from trade. It uses a specific formula that involves integrating the difference between the demand and supply curves from zero to the equilibrium quantity. The paragraph outlines the steps to graph the demand and supply curves, find their intersection point, and identify the equilibrium quantity and price. It then guides through the process of setting up the integral, simplifying the demand and supply functions, and performing the integration to find the total gains from trade. The example concludes with the calculation of the integral using an antiderivative and evaluating it at the equilibrium quantity to obtain the total social benefits of trade, which in this case is 4.
Mindmap
Keywords
💡Social Benefit of Trade
💡Demand Curve
💡Supply Curve
💡Equilibrium Point
💡Consumer Surplus
💡Producer Surplus
💡Total Gains from Trade
💡Integral
💡Equilibrium Quantity
💡Equilibrium Price
💡Antiderivative
💡Desmos
Highlights
The video explains the concept of total social benefit of trade, also known as gains from trade.
Demand and supply curves are graphed on the same axes to illustrate equilibrium point.
Equilibrium point is where supply and demand are balanced at the equilibrium price.
Consumer surplus is the area below the demand curve and above the equilibrium price line.
Producer surplus is the area above the supply curve and below the equilibrium price line.
Combining consumer and producer surplus gives the social benefits of trade.
Consumer surplus represents savings for consumers as they spend less than they are willing to.
Producer surplus indicates that producers earn more revenue than their minimum acceptable amount.
The formula for calculating the social benefit of trade is an integral from 0 to the equilibrium quantity (q) of the demand curve minus the supply curve.
The integral represents the area between the demand and supply curves from zero to the equilibrium quantity.
An example is provided to demonstrate how to determine the equilibrium point and calculate gains from trade.
The equilibrium point is found where the demand and supply curves intersect, with a quantity (q) of 1 and a price (p) of 9.
Consumer and producer surplus areas are identified on the graph to calculate social benefits.
The integral calculation is simplified by subtracting the constant terms from the integral.
The antiderivative of the simplified integral is calculated to find the area under the curve.
Desmos or manual calculation can be used to evaluate the antiderivative at the equilibrium quantity.
The total gains from trade are calculated to be 4, demonstrating the process step by step.
The video concludes by summarizing the method for solving gains from trade problems.
Transcripts


5.0 / 5 (0 votes)
Thanks for rating: