Understanding the Demand Curve: Shifts and Consumer Surplus
TLDRIn this educational video, Tyler explains the concept of a demand curve, illustrating how it represents the relationship between price and quantity demanded. He demonstrates two methods of reading a demand curve, emphasizing the importance of understanding both for problem-solving. The script also introduces consumer surplus, describing it as the difference between what consumers are willing to pay and the market price, and visually represents it as the area below the demand curve and above the price. The lecture concludes with a practical example of calculating consumer surplus in a linear demand scenario, setting the stage for future discussions on factors affecting demand shifts.
Takeaways
- 📈 A demand curve represents the relationship between the quantity of a good demanded and its price, showing that as price decreases, quantity demanded increases.
- 💡 The quantity demanded refers to the amount of a product that consumers are willing and able to purchase at a specific price point.
- 📊 The demand curve can be derived from a table of hypothetical market data, such as the quantity of oil demanded at various prices, and then graphed on a chart.
- 🔍 There are two ways to read a demand curve: horizontally to find the quantity demanded at a given price, and vertically to determine the maximum price consumers are willing to pay for a specific quantity.
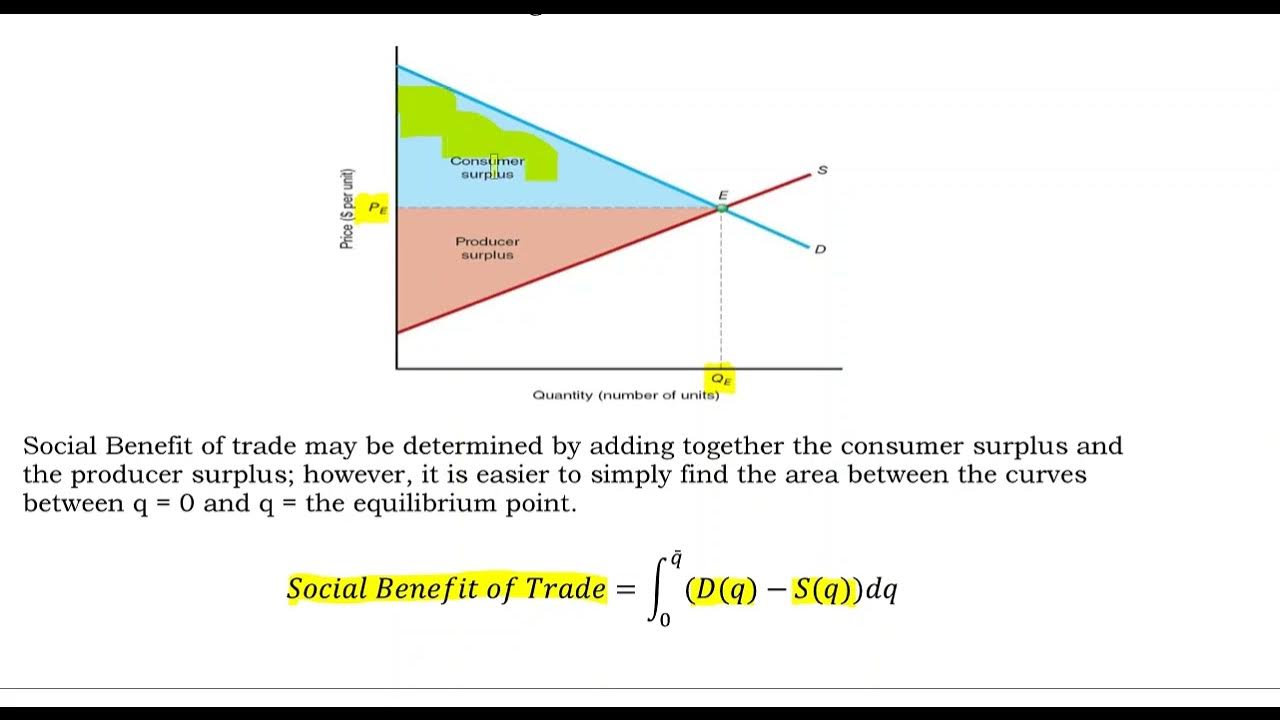
- 🛒 Consumer surplus is the difference between what a consumer is willing to pay for a product and the actual market price they pay, representing the consumer's gain from the transaction.
- 📐 Graphically, consumer surplus is represented by the area under the demand curve and above the market price, which can be calculated as the area of a triangle in the case of a linear demand curve.
- 🤔 Understanding both horizontal and vertical readings of the demand curve is crucial for solving different types of economic problems.
- 📚 The script emphasizes the importance of being comfortable with interpreting demand curves, as they are a fundamental concept in economic analysis.
- 📉 The demand curve typically slopes downwards, indicating that as price decreases, consumers demand more of the product, which is an intuitive economic principle.
- 📈 The next lecture will cover factors that can cause shifts in the demand curve, such as an increase or decrease in demand, which are represented by the demand curve shifting out or in, respectively.
- 📝 The video script concludes with an invitation to practice understanding demand curves and consumer surplus through provided questions, reinforcing the concepts learned.
Q & A
What is the definition of a demand curve?
-A demand curve is a graphical representation that shows the relationship between the quantity demanded of a good or service and its price. It illustrates the quantity that buyers are willing and able to purchase at various price levels.
How does the quantity demanded change with price according to the demand curve?
-According to the demand curve, the quantity demanded of a good or service typically increases as the price decreases. This inverse relationship is known as the law of demand.
What is the difference between the horizontal and vertical readings of a demand curve?
-The horizontal reading of a demand curve shows the quantity demanded at a specific price by reading horizontally from the price to the curve and then down to the quantity axis. The vertical reading starts at a chosen quantity and reads vertically up to the demand curve to find the maximum price consumers are willing to pay for that quantity.
What is consumer surplus and how is it measured graphically?
-Consumer surplus is the difference between the maximum price a consumer is willing to pay for a good and the market price they actually pay. Graphically, it is measured by the area below the demand curve and above the market price.
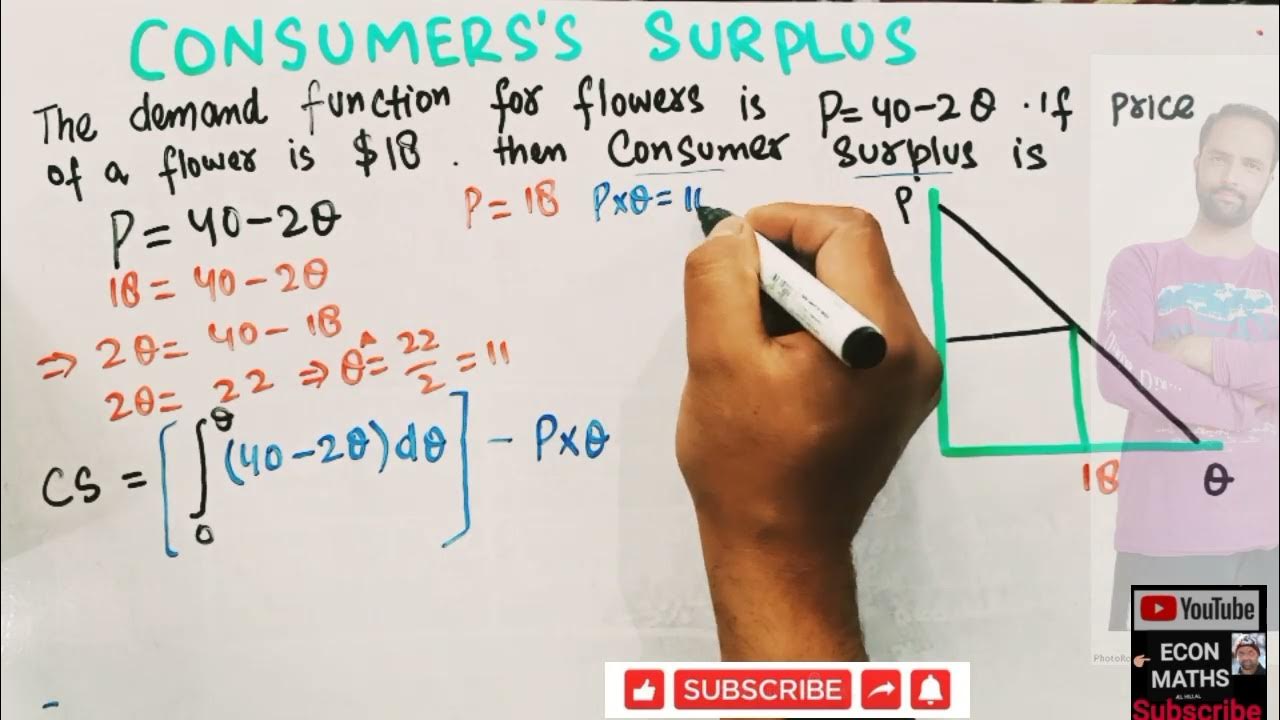
How is the total consumer surplus calculated when the demand curve is linear?
-When the demand curve is linear, the total consumer surplus can be calculated as the area of a triangle formed by the demand curve, the market price, and the quantity axis. The area is given by half the base (difference between the maximum willingness to pay and the market price) times the height (quantity).
Why is it important to understand both the horizontal and vertical readings of the demand curve?
-Understanding both readings is important because different problems may require different approaches. The horizontal reading helps to determine the quantity demanded at a given price, while the vertical reading helps to find the maximum price consumers are willing to pay for a specific quantity.
What is the significance of the slope of the demand curve?
-The slope of the demand curve, which is typically downward-sloping, signifies that as the price of a good or service decreases, the quantity demanded by consumers generally increases, reflecting the law of demand.
Can you provide an example of how the quantity demanded for oil changes with price from the script?
-In the script, it is given that at a price of $55 per barrel, the quantity of oil demanded is five million barrels per day. However, at a lower price of $5 per barrel, the quantity demanded increases to 50 million barrels per day.
What factors could potentially cause the demand curve to shift, as hinted in the script?
-Although not detailed in the script, factors that could cause the demand curve to shift include changes in consumer income, preferences, the price of related goods (substitutes or complements), expectations about future prices, and population size.
How is the consumer surplus for an individual calculated in the context of the script?
-In the script, the consumer surplus for an individual is calculated as the difference between the maximum price they are willing to pay for a good and the actual market price they pay. For example, if a consumer values oil at close to $80 but pays only $20, their consumer surplus is approximately $60.
What is the purpose of the practice questions mentioned at the end of the script?
-The practice questions are designed to test and reinforce the viewer's understanding of the concepts covered in the lecture, such as reading a demand curve and calculating consumer surplus.
Outlines
📈 Introduction to Demand Curves and Their Reading Methods
This paragraph introduces the concept of a demand curve, which illustrates the relationship between the quantity of a good demanded and its price. The demand curve slopes downward, indicating that as price decreases, the quantity demanded increases. Two methods of reading the demand curve are explained: the horizontal method, which shows the quantity consumers are willing and able to purchase at a given price, and the vertical method, which reveals the maximum price consumers are willing to pay for a specific quantity. The paragraph also introduces the concept of consumer surplus, which is the difference between what consumers are willing to pay and what they actually pay, measured as the area below the demand curve and above the market price.
💰 Understanding Consumer Surplus and Its Calculation
In this paragraph, the concept of consumer surplus is further elaborated, emphasizing its importance as the gain from exchange for consumers. It is defined as the difference between the maximum price a consumer is willing to pay for a given quantity and the market price they actually pay. The paragraph demonstrates how to calculate consumer surplus graphically, using the area under the demand curve and above the market price as an indicator. An example is provided with a linear demand curve, where the total consumer surplus is calculated as half the product of the base and height of the triangle formed by the demand curve and the market price. The paragraph concludes with a preview of future topics, such as factors that can cause shifts in the demand curve.
Mindmap
Keywords
💡Demand Curve
💡Quantity Demanded
💡Price
💡Consumer Surplus
💡Horizontal Reading
💡Vertical Reading
💡Market Price
💡Willingness to Pay
💡Graphical Representation
💡Shifting of Demand Curve
Highlights
Introduction to demand and its importance in the market.
Definition of a demand curve as a function showing quantity demanded at different prices.
Explanation of quantity demanded as the amount buyers are willing and able to purchase at a specific price.
Example of a market demand curve for oil with hypothetical price and quantity data.
Conversion of data into a graphical representation with price on the vertical axis and quantity on the horizontal axis.
Graphical illustration of the demand curve for oil, showing quantity demanded at various prices.
Key point that the demand curve slopes downwards, indicating greater quantity demanded at lower prices.
Two methods of reading the demand curve: horizontal for quantity at a given price and vertical for maximum price buyers are willing to pay.
Importance of being comfortable with both reading methods for solving different problems.
Introduction to the concept of consumer surplus as the gain from exchange for consumers.
Consumer surplus defined as the difference between the maximum price a consumer is willing to pay and the market price.
Graphical representation of consumer surplus as the area below the demand curve and above the price.
Explanation of how to read the demand curve vertically to determine maximum willingness to pay.
Calculation of total consumer surplus as the sum of individual consumer surpluses.
Practical example of calculating consumer surplus using a linear demand curve and high school geometry.
Preview of the next lecture focusing on factors causing an increase or decrease in demand and their graphical representation.
Encouragement to practice understanding of demand curves and consumer surplus through provided questions.
Transcripts


5.0 / 5 (0 votes)
Thanks for rating: