Math 11 - Sections 1.3-1.4
TLDRProfessor Monti's lecture delves into the concepts of average rates of change and differentiation in calculus. Starting with a graphical representation of a function's change over time, the professor illustrates how to calculate the average rate of change between two points on a curve. This concept is then linked to the secant line's slope between two points on a curve, emphasizing that the average rate of change is essentially the slope of the secant line. The lecture transitions into the difference quotient, a formula for the average rate of change, and its simplification. The professor also discusses the application of these concepts to find the average rate of change for a given function, using algebraic manipulation. The lecture further explores the significance of the difference quotient in determining the instantaneous rate of change and introduces the concept of the derivative, denoted as F prime of X, as the limit of the difference quotient as H approaches zero. The derivative is identified as the slope of the tangent line at a specific point on the curve, signifying the instantaneous rate of change. The lecture concludes with examples of finding derivatives using the limit definition and a discussion on when a function is not differentiable, such as at points of discontinuity, corners, or vertical tangents. The professor encourages students to practice these concepts for a deeper understanding and to excel in their studies.
Takeaways
- 📈 The concept of average rates of change is introduced as the change in the dependent variable (miles) over the change in the independent variable (hours), which is also the slope of the secant line through two points on a curve.
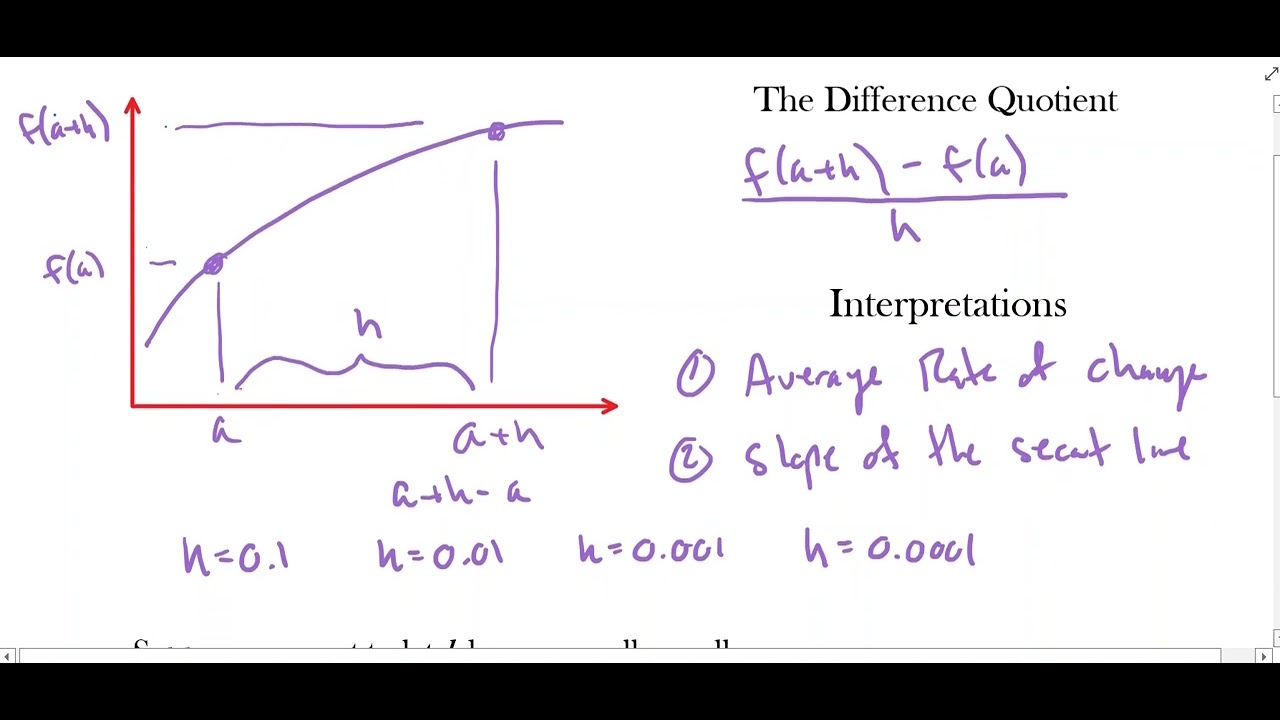
- 🔍 The difference quotient, f(x + h) - f(x) / h, is used to find the average rate of change and represents the slope of the secant line between two points on the curve of a function.
- 📐 The secant line is a line passing through two points on a curve, and as the points get closer, the secant line approximates the tangent line, which touches the curve at a single point.
- 🔑 The slope of the tangent line at a specific point on a curve is found by taking the limit of the difference quotient as h approaches zero, resulting in the derivative of the function at that point.
- 🌟 The derivative, f'(x), represents the instantaneous rate of change of a function at a particular point and is a foundational concept in calculus for analyzing changes in quantities.
- 📊 A function is differentiable at a point if its derivative exists at that point, meaning there is a well-defined instantaneous rate of change.
- 🚫 A function is not differentiable at points where it is not continuous, has a corner (cusp), or has a vertical tangent line, as these points do not have a well-defined slope.
- 🤔 The process of finding derivatives involves algebraic manipulation and understanding the behavior of the function, especially when simplifying expressions involving limits.
- 📉 The given example of the revenue function R(x) demonstrates how the derivative can be used to find the average rate of change in revenue with respect to the number of iPod holders sold.
- 📚 The theoretical foundation laid out in this script is essential for understanding more complex derivative concepts and rules that will be introduced in subsequent sections.
- 🎯 The significance of finding the derivative is not just in calculating a numerical value, but in interpreting what that value means in terms of the rate of change or the behavior of the function at a specific point.
Q & A
What is the concept of average rates of change?
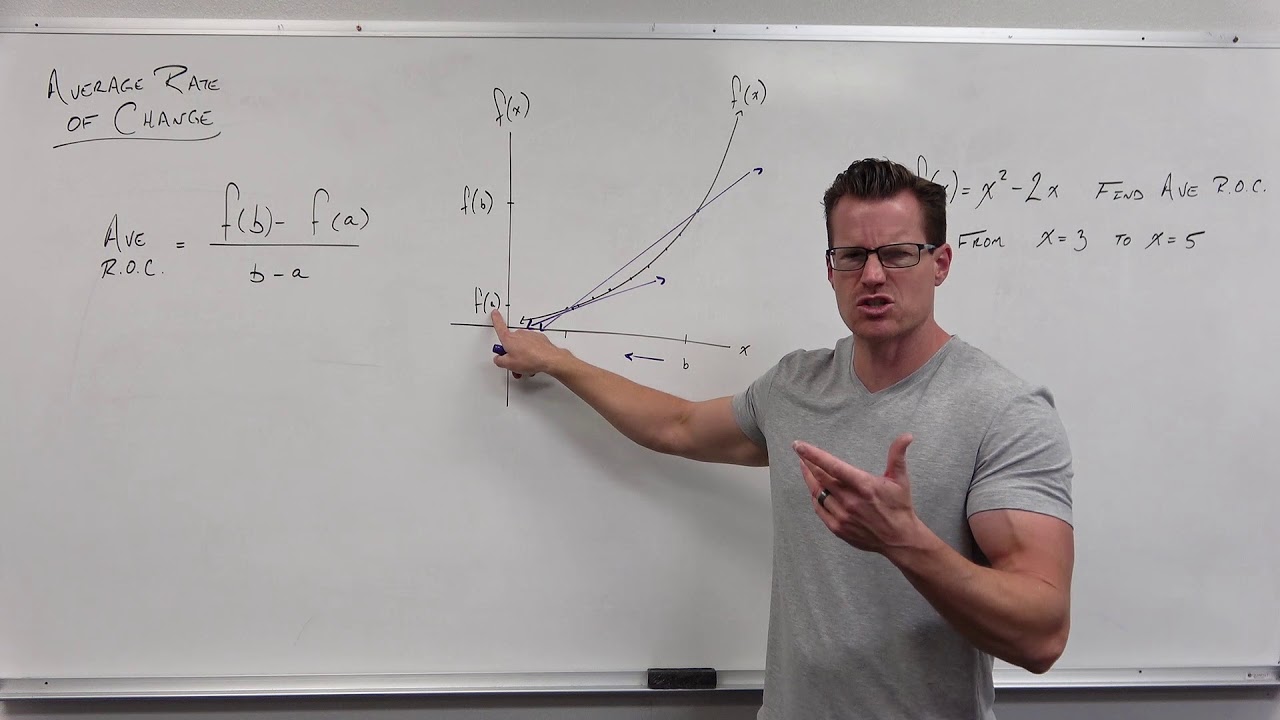
-The average rate of change of a function between two points is the ratio of the change in the function's output (the change in 'y') to the change in input (the change in 'x'). It is essentially the slope of the secant line between two points on the function and represents the average speed at which the function's value changes over that interval.
How is the slope of a secant line related to the average rate of change?
-The slope of a secant line, which passes through two points on a curve, is equal to the average rate of change of the function between those two points. It is calculated as the change in the function's value (Δy) divided by the change in the x-values (Δx).
What is the difference quotient?
-The difference quotient is a formula used to estimate the average rate of change of a function at a particular point. It is represented as (f(x + h) - f(x)) / h, where 'f' is the function, 'x' is the point of interest, and 'h' is a small change in x.
How does the difference quotient relate to the slope of the secant line?
-The difference quotient is essentially the slope of the secant line between the point (x, f(x)) and a nearby point (x + h, f(x + h)). As 'h' approaches zero, the difference quotient approaches the slope of the tangent line at the point (x, f(x)), which is the instantaneous rate of change at that point.
What is the significance of the instantaneous rate of change?
-The instantaneous rate of change, or the derivative, gives the rate of change of a function at a specific point, rather than over an interval. It is the limit of the average rate of change as the interval becomes infinitesimally small. This concept is crucial in calculus for determining the tangent line's slope at a point and for analyzing how quantities change at that instant.
Why can't you find the slope of a vertical line using the standard slope formula?
-The standard slope formula requires two distinct points to calculate the slope. A vertical line does not have a defined slope because it has an infinite rate of change; it goes straight up or down. The concept of slope in the traditional sense does not apply to vertical lines because the change in 'y' (Δy) is infinite for any nonzero change in 'x' (Δx).
What is the significance of the derivative of a function at a point?
-The derivative of a function at a point gives the slope of the tangent line to the function at that point. It represents the instantaneous rate of change of the function at that specific point, which is useful for understanding how a quantity changes at that precise moment.
Under what conditions is a function not differentiable at a point?
-A function is not differentiable at a point if the graph is not continuous at that point, there is a sharp corner or cusp, or if the tangent line is vertical (undefined slope) at that point.
What is the relationship between the derivative of a function and the slope of the graph of the function?
-The derivative of a function at a point is equal to the slope of the graph of the function at that point. If the function is a line (linear), then the derivative (slope of the tangent line) is constant and equal to the slope of the line. If the function is a curve, the derivative varies from point to point, reflecting the changing slope of the curve.
How does the concept of limits come into play when finding the derivative of a function?
-The concept of limits is fundamental in finding the derivative of a function. The derivative is defined as the limit of the difference quotient as 'h' approaches zero. This process allows us to find the instantaneous rate of change at a specific point on the curve, which is the slope of the tangent line at that point.
What does the term 'differentiable' mean in the context of calculus?
-In calculus, a function is said to be 'differentiable' at a point if there exists a derivative (a rate of change) at that point. This means that the function has a well-defined slope at that point, and a tangent line can be drawn that 'touches' the curve at that point without crossing it.
Outlines
📈 Introduction to Average Rates of Change
Professor Monti begins by introducing the concept of average rates of change, using an example of a function that represents miles traveled over time. He sketches a curve to illustrate how the rate of change can vary and explains how to calculate the average rate of change between two points by finding the slope of the secant line through those points. This leads to a discussion of the difference quotient as a method for determining the average rate of change.
🔢 Difference Quotient and Secant Line
The video continues with a deeper look into the difference quotient, a formula used to calculate the slope of a secant line between two points on a curve. The professor demonstrates how the difference quotient represents the average rate of change and connects this concept to the idea of the slope of a line. He emphasizes that for a linear function, the average rate of change is constant, whereas for a curve, it varies.
📚 Solving Problems with Average Rates of Change
The script outlines a step-by-step approach to solving problems that involve finding the average rate of change for a given function between two points. The professor works through an example problem, calculating the average rate of change for a quadratic function and graphically representing the secant line that corresponds to this rate.
📉 Application: Revenue and Average Rate of Change
An application problem is presented, where the company Fast Trends is looking to understand the average rate of change in revenue from selling iPod holders. The professor demonstrates how to calculate this rate by finding the difference in revenue over the change in the number of iPod holders sold, emphasizing the interpretation of the result as an average increase in revenue per holder sold.
🔍 Simplifying the Difference Quotient
The focus shifts to simplifying the difference quotient for a given function, f(x) = x^2 + x. The professor shows how to algebraically manipulate the difference quotient to find a simplified form that represents the average rate of change. He then uses this simplified form to fill out a table with specific values of x and h.
🤔 Tangent Lines and Instantaneous Rates of Change
The script delves into the concept of tangent lines and how they relate to the instantaneous rate of change of a function at a specific point. The professor differentiates between secant lines, which provide an average rate of change, and tangent lines, which give the instantaneous rate of change. He illustrates the process of finding the slope of the tangent line by taking the limit of the difference quotient as the interval between points (h) approaches zero.
📐 Differentiability and the Derivative
The professor discusses the conditions under which a function is differentiable, meaning it has a derivative at a point. He explains that a function is not differentiable where there are discontinuities, corners, or vertical tangent lines. The concept of the derivative as the slope of the tangent line and the instantaneous rate of change is further explored, with the notation f'(x) introduced to represent the derivative of f(x).
📉 Identifying Points of Non-Differentiability
The script concludes with an example problem that identifies points where a function is not differentiable. The professor explains that a function is not differentiable at points of discontinuity, corners, or where the tangent line is vertical. He provides a method to list such points based on the behavior of the function's graph.
🎓 Summary and Encouragement
In the final paragraph, the professor summarizes the key points covered in the session and encourages students to practice the concepts learned. He acknowledges the theoretical nature of the material and assures students that upcoming sections will focus more on practical applications. He ends with well wishes for the students' success on their homework and future tests.
Mindmap
Keywords
💡Average Rate of Change
💡Secant Line
💡Slope
💡Difference Quotient
💡Derivative
💡Tangent Line
💡Limit
💡Instantaneous Rate of Change
💡Continuous Function
💡Non-Differentiable Points
💡Graph of a Function
Highlights
Professor Monti introduces sections 1.3 and 1.4 focusing on average rates of change and differentiation.
A graphical representation is used to explain the concept of average rates of change in terms of the slope of a secant line.
The difference quotient is derived as a method to calculate the average rate of change between two points on a curve.
The slope of the secant line is identified as the average rate of change for a function between two points.
The concept of the instantaneous rate of change is introduced as the slope of the tangent line at a single point on a curve.
The significance of the average rate of change is demonstrated through a problem involving the revenue from the sale of iPod holders.
The process of finding the simplified form of the difference quotient for a given function is explained.
A step-by-step approach to graphing a function and finding the slope of the tangent line at specific points is demonstrated.
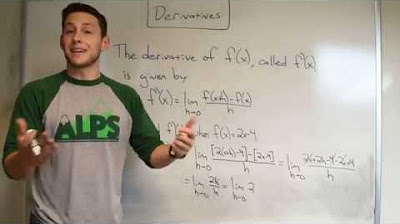
The definition of a derivative is formally presented as the limit of the difference quotient as H approaches zero.
The derivative is identified as the instantaneous rate of change of a function at a single point.
The concept of differentiability is explored, noting when a function has a derivative and when it does not.
Examples of functions that are not differentiable at certain points due to discontinuities, corners, or vertical tangent lines are provided.
The importance of understanding the meaning behind mathematical operations is emphasized for better comprehension and retention.
The lecture concludes with an encouragement to practice and apply the theoretical concepts to excel in future practical applications.
The next section will cover more practical applications and move away from the theoretical aspects covered in the initial sections.
The importance of completing homework to ensure a strong grasp of derivatives and their applications is highlighted.
Transcripts
Browse More Related Video

5.0 / 5 (0 votes)
Thanks for rating: