Specific-Mortality Rates
TLDRThis video script delves into the intricacies of mortality rates, moving beyond the concept of crude mortality rates to explore more nuanced metrics. It introduces age-specific mortality rates, which segment the population into age groups to provide a detailed view of death rates within each. The formula for these rates is similar to that of crude rates, with the number of deaths in a year divided by the mid-year population count for that age group. The script also discusses how to apply the same principle to disease-specific or cause-specific mortality rates, which compare the number of deaths from a particular disease to the total population. Additionally, it touches on the case fatality rate, which measures the severity of a disease by comparing the number of deaths to the number of cases. Finally, the script explains proportionate mortality, which indicates the proportion of total deaths attributed to a specific cause. The video uses examples from the CDC and WHO to illustrate these concepts, providing a comprehensive understanding of how mortality rates can be analyzed and compared across different demographics and time periods.
Takeaways
- 📊 The discussion shifts from crude mortality rates to more specific ones, focusing on mortality rates within different age groups.
- 👶 Age-specific mortality rates are calculated by dividing the number of deaths in a particular age group in a year by the total number of people in that age group at mid-year.
- 📈 The script uses CDC data from 2007 to illustrate how age-specific mortality rates can vary significantly among states in the United States.
- 🚨 Alabama, D.C., and Mississippi were highlighted as having concerning age-specific mortality rates, particularly for infants.
- 🔢 Mortality rates are often expressed per 100,000 people for broader comparisons, but the script emphasizes the importance of consistent criteria for both numerator and denominator.
- 🗓️ Age-specific rates can be further broken down by disease to calculate disease-specific or cause-specific mortality rates.
- 💼 The formula for disease-specific mortality rates is the number of deaths from a particular disease in one year over the total population at mid-year, usually multiplied by a factor like 1000 for easier interpretation.
- 🔄 Comparing disease-specific mortality rates over time can reveal trends in the severity or prevalence of a disease.
- 📉 Case fatality rate is introduced as a measure of disease severity, calculated by dividing the number of deaths from a disease by the number of people with that disease at mid-year.
- 🏆 Proportionate mortality is explained as the percentage of total deaths caused by a specific disease, showing its relative impact on the population.
- 🌐 Global data from the World Health Organization is used to demonstrate how proportionate mortality can illustrate leading causes of death worldwide.
- 🔄 Changes in proportionate mortality for one disease may reflect changes in another, and do not necessarily indicate a real change in the number of deaths.
Q & A
What is the main focus of the conversation in the transcript?
-The main focus of the conversation is on understanding different types of mortality rates, including age-specific, cause-specific (disease-specific), case fatality rate, and proportionate mortality.
How is age-specific mortality rate calculated?
-Age-specific mortality rate is calculated by dividing the number of deaths in a particular age group within a year by the total number of people in that age group at mid-year.
Why is it important to apply the same criteria to both the numerator and the denominator in mortality rate calculations?
-It is important because consistency ensures the accuracy and comparability of the mortality rates across different groups or time periods.
What does the case fatality rate measure?
-The case fatality rate measures the severity of a disease by comparing the number of deaths from the disease to the number of people diagnosed with the disease in a given time period.
How can cause-specific mortality rates be used for comparing diseases across time periods?
-Cause-specific mortality rates can be used to compare the mortality of a specific disease across different time periods by comparing the number of deaths from that disease in different years.
What is the definition of proportionate mortality?
-Proportionate mortality refers to the percentage of all deaths in a given year that are caused by a specific disease, showing the disease's contribution to the total mortality burden.
How can changes in proportionate mortality be indicative of changes in other diseases' mortality rates?
-Changes in proportionate mortality for one disease can reflect changes in other diseases' mortality rates because an increase in the proportion of deaths from one cause could mean that deaths from other causes have decreased, assuming the total number of deaths remains constant.
What is the significance of comparing age-specific mortality rates across different states, as mentioned in the transcript?
-Comparing age-specific mortality rates across different states can help identify regions that may have poorer healthcare, lifestyle factors, or environmental conditions contributing to higher mortality rates in certain age groups.
According to the transcript, which states had higher infant mortality rates in the United States in 2007?
-The states with higher infant mortality rates in 2007, according to the transcript, were Alabama, District of Columbia (DC), and Mississippi.
What is the difference between cause-specific mortality rates and case fatality rates?
-Cause-specific mortality rates compare the number of deaths from a specific cause to the total population, while case fatality rates compare the number of deaths from a specific cause to the number of people diagnosed with that cause, reflecting the severity of the disease.
Why is it useful to understand different types of mortality rates?
-Understanding different types of mortality rates is useful for public health officials, researchers, and policymakers to identify trends, assess the impact of interventions, and allocate resources effectively to address specific health issues in various populations.
Outlines
📊 Age-Specific Mortality Rates
This paragraph discusses the concept of age-specific mortality rates, which are calculated by dividing the number of deaths in a particular age group within a year by the total number of people in that age group at mid-year. The importance of consistency in criteria between the numerator (number of deaths) and the denominator (total population) is emphasized. An example from the CDC website is provided, illustrating age-specific mortality rates in the United States in 2007, including a comparison of states like Alabama, DC, and Mississippi for infant mortality rates. The paragraph concludes with a mention of disease-specific mortality rates, which are calculated similarly but focus on deaths from a specific disease rather than age groups.
📈 Disease-Specific and Case Fatality Rates
The second paragraph delves into disease-specific mortality rates, also known as cause-specific mortality rates, which measure the number of deaths from a particular disease over the total population at mid-year. It contrasts this with the case fatality rate, which is the ratio of deaths from a disease to the number of people who have that disease. The case fatality rate is a measure of disease severity and can be used to compare different diseases. The paragraph also introduces the concept of proportionate mortality, which is the proportion of all deaths that are due to a specific cause. An example from Wikipedia is given, listing the ten leading causes of death in 2002 and their respective proportions. The discussion highlights that changes in proportionate mortality for one disease may be due to changes in another, not necessarily reflecting a change in the actual number of deaths from the first disease. The paragraph concludes by summarizing the different types of mortality rates covered and their comparative value.
Mindmap
Keywords
💡Crude Mortality Rate
💡Age-Specific Mortality Rate
💡Cause-Specific Mortality Rate
💡Case Fatality Rate
💡Proportionate Mortality
💡CDC (Centers for Disease Control and Prevention)
💡Infant Mortality Rate
💡Ischemic Heart Disease
💡Stroke
💡Pneumonia
💡HIV/AIDS
Highlights
The video discusses transitioning from crude mortality rates to more specific ones, such as age-specific mortality rates.
Population is divided into age groups (e.g., 0-10, 10-20, 70-80 years old) to calculate mortality rates for each group.
Age-specific mortality rate is calculated by dividing the number of deaths in an age group by the total number of people in that group at mid-year.
The importance of applying the same criteria to both the numerator and denominator in calculating mortality rates is emphasized.
An example from the CDC website in 2007 is used to illustrate age-specific mortality rates in the United States.
Alabama is identified as having the worst overall mortality rate among the listed states.
The video breaks down mortality rates for different age groups, including infants and older age groups.
Disease-specific or cause-specific mortality rates are introduced, using lung cancer as an example.
The formula for disease-specific mortality rates is the number of deaths from a disease divided by the total population at mid-year.
The case fatality rate is explained, which measures the severity of a disease by comparing the number of cases to the number of fatalities.
Comparisons of case fatality rates between lung cancer and other diseases, such as pneumonia, are discussed.
Proportionate mortality is introduced, which represents the proportion of all deaths due to a specific cause.
An example of proportionate mortality is given, using the ten leading causes of death in 2002 according to the World Health Organization.
Changes in the proportion of deaths due to one disease can reflect changes in mortality of another disease, not necessarily an actual change in the number of deaths.
The video concludes by contrasting specific mortality rates with crude mortality rates previously discussed.
The next video will continue the discussion on mortality, suggesting a series on the topic.
Transcripts
Browse More Related Video

Mortality Rates (Part 2)
MORTALITY RATES and RATIOS - Epidemiology | Lecture 2 - PSM (Community Medicine) MEDVIDSMADESIMPLE

Age standardised mortality rate
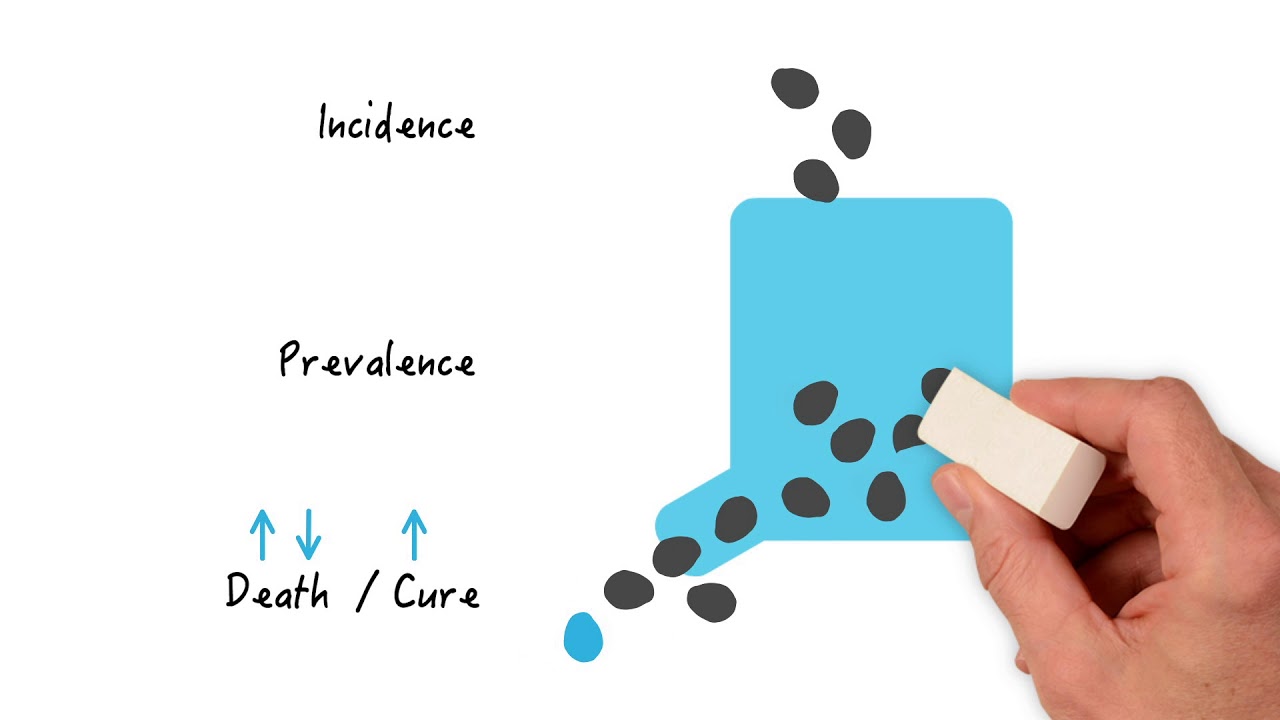
Incidence vs Prevalence: Understanding Disease Metrics

CDC data shows rise in maternal mortality and deaths of Black infants in U.S.

High deaths in middle age
5.0 / 5 (0 votes)
Thanks for rating: