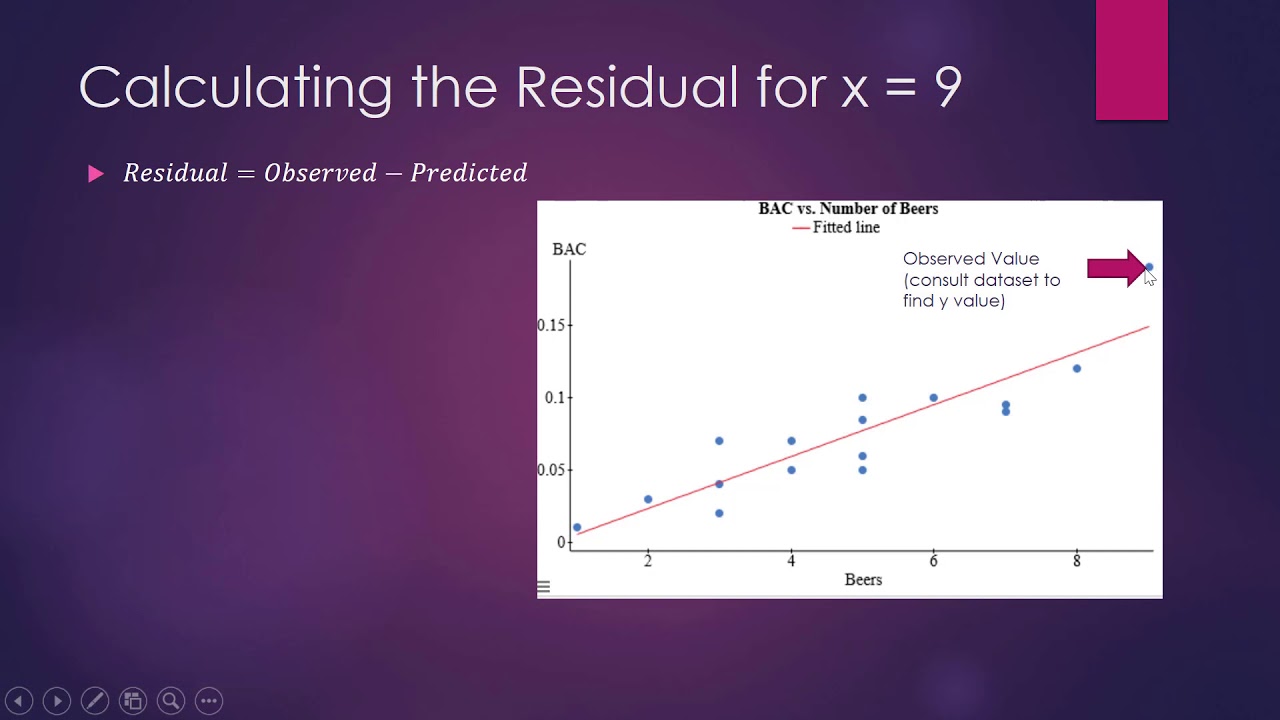
How to Calculate A Residual
TLDRThe video script discusses the concept of residuals in the context of data analysis. It defines residuals as the difference between the actual and predicted values of an ordered pair, emphasizing the vertical distance represented by the 'y' value. The script uses a practical example of people attending a lecture versus hours, illustrating how residuals are calculated by subtracting the predicted 'y hat' value from the actual 'y' value. The significance of positive and negative residuals is also explained, highlighting how they indicate whether the best fit line has overestimated or underestimated the values, respectively.
Takeaways
- 📊 A residual is defined as the difference between the actual observed value and the predicted value, calculated as actual minus predicted.
- 🔍 In the context of data analysis, residuals represent the vertical distance between data points and the line of best fit.
- 🌟 The symbol for residual is 'R', and it is always calculated as the actual y value minus the predicted y hat value of an ordered pair.
- 📉 When a residual is positive, it indicates that the actual value is above the best fit line, meaning the model has underestimated the observation.
- 📴 Conversely, a negative residual implies that the actual value is below the best fit line, suggesting that the model has overestimated the observation.
- 🤔 The size of the residual indicates the degree of discrepancy between the predicted and actual values; larger residuals suggest a greater difference.
- 🧮 To calculate a residual, use the equation of the best fit line and substitute the value of the explanatory variable (x) to find the predicted value (y hat).
- 📌 An actual point on the predicted line has a residual of zero, as there is no difference between the predicted and actual values at that point.
- 🔎 Analyzing residuals can provide insights into the accuracy and reliability of a model, as well as reveal patterns or outliers in the data.
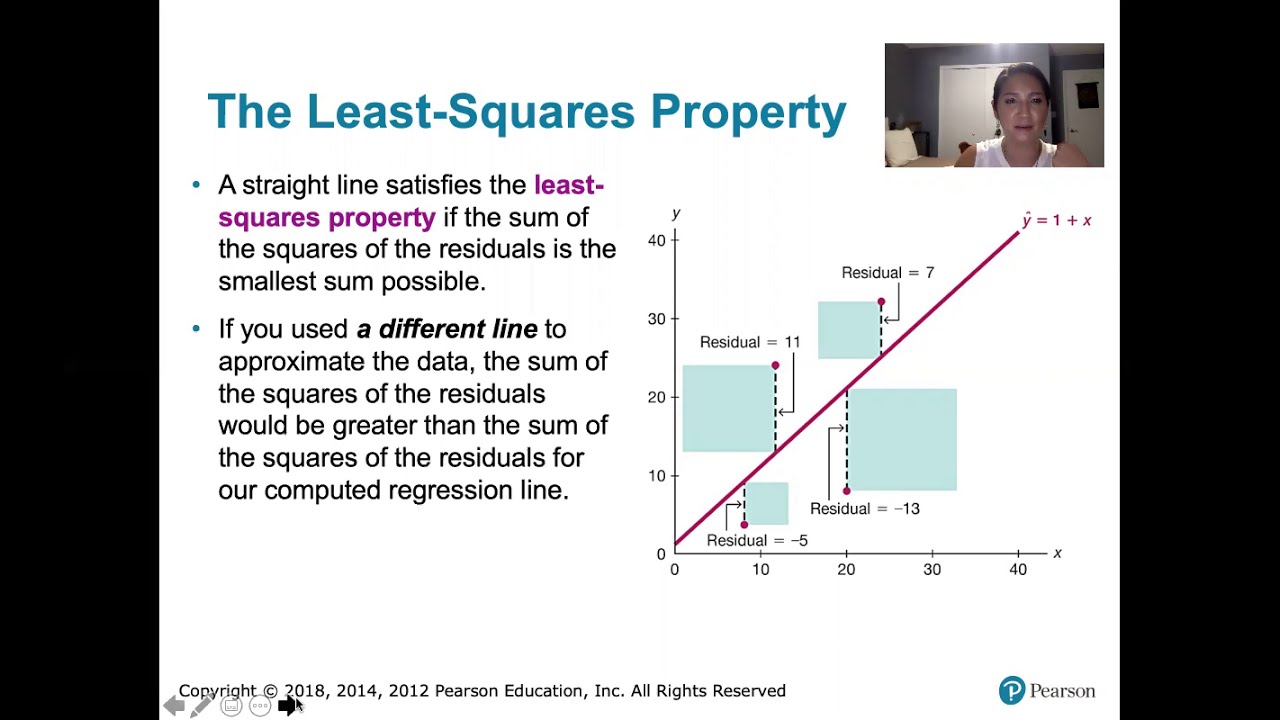
- 📈 In a scatter plot, the best fit line aims to minimize the overall sum of residuals, which is a measure of the model's performance.
- 🚦 Understanding residuals is crucial for model validation and improvement, as they highlight areas where the model may need adjustment or refinement.
Q & A
What is a residual in the context of the provided transcript?
-A residual is the difference between the actual observed value and the predicted value, calculated as the actual point minus the predicted point. It represents the vertical distance between an observed data point and the line of best fit in a scatter plot.
How is the residual symbolized in the transcript?
-In the transcript, the residual is symbolized as 'residual = actual - predicted' or 'residual = y - y_hat', where 'y' is the actual y-value of an ordered pair and 'y_hat' is the predicted y-value.
What does a positive residual indicate in the context of the best fit line?
-A positive residual indicates that the data point is above the best fit line, meaning that the best fit line has underestimated the actual value for that particular point.
What does a negative residual indicate in the context of the best fit line?
-A negative residual indicates that the data point is below the best fit line, meaning that the best fit line has overestimated the actual value for that particular point.
How is the best fit line represented in the transcript example?
-In the transcript example, the best fit line is represented by a line on a scatter plot that is derived from a given equation. The equation is used to predict the y-values (number of people) based on the x-values (hours).
What is the purpose of calculating residuals?
-Calculating residuals helps in assessing the accuracy of a predictive model. It provides insight into how well the model fits the data by measuring the discrepancies between the observed and predicted values.
What does the size of the residual indicate about the model's prediction?
-The size of the residual indicates the degree of error in the model's prediction. A larger residual implies a greater difference between the predicted and actual values, suggesting a less accurate prediction for that point.
How do you calculate the residual for a point where the explanatory variable x is 3 hours?
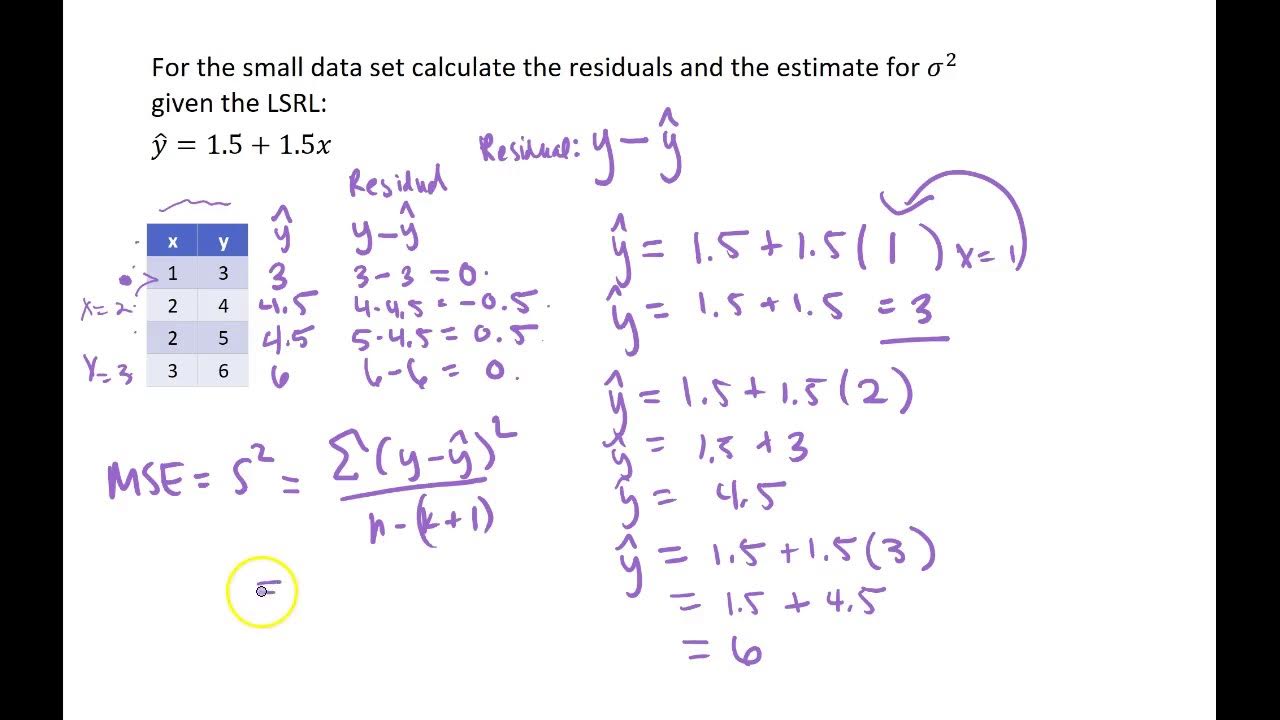
-To calculate the residual for x=3 hours, you would use the equation of the best fit line to find the predicted value (y_hat) for 3 hours, and then subtract this predicted value from the actual observed value (y) for the same x value. In the transcript example, the predicted value (y_hat) is 45.46 and the actual value (y) is 50, so the residual is 50 - 45.46 = 4.54.
What is the significance of the residual in the context of a scatter plot?
-The residual in the context of a scatter plot provides a visual and quantitative measure of the deviation of data points from the line of best fit. It helps in identifying patterns or outliers that may not be captured by the model and can guide further analysis or model adjustments.
How does the number of people attending a lecture relate to the hours in the transcript example?
-In the transcript example, there is an inverse relationship between the number of hours (x) and the number of people attending a lecture (y). As the hours increase, the number of people attending the lecture decreases, which is reflected in the downward slope of the best fit line on the scatter plot.
What is the role of the best fit line in the context of residuals?
-The best fit line serves as a reference for calculating residuals. It represents the average predicted outcome based on the model, and the residuals measure the deviation of individual data points from this average prediction.
Why might a point have a residual of zero?
-A point will have a residual of zero if it lies exactly on the best fit line. This means that the predicted value for that point is equal to the actual observed value, indicating a perfect prediction by the model for that specific data point.
Outlines
📊 Introduction to Residuals and Calculation
This paragraph introduces the concept of residuals in the context of data analysis and regression. A residual is defined as the difference between the actual observed value and the predicted value, calculated as the actual point minus the predicted point (actual - predicted). The emphasis is on the vertical distance between points, highlighting that residuals are concerned with the y-value of an ordered pair. An example is provided where the explanatory variable x represents hours, and y represents the number of people attending a lecture. As hours increase, attention span decreases, illustrating the relationship through a scatter plot with a best-fit line. The calculation of a residual for a specific point (3 hours with 50 people remaining in the lecture) is demonstrated, showing the process of using the best-fit line equation to predict the number of attendees and then determining the residual by subtracting the predicted value from the actual value, resulting in a residual of 4.56 for the given example.
📈 Interpretation of Positive and Negative Residuals
This paragraph delves into the interpretation of positive and negative residuals in relation to their position relative to the best-fit line. A positive residual indicates that the actual point is above the line, suggesting that the best-fit line has underestimated the number of people. Conversely, a negative residual indicates that the actual point is below the line, meaning the best-fit line has overestimated the number of people. The explanation reinforces the importance of understanding residuals in evaluating the accuracy of a model's predictions and provides insight into how to assess whether the model is overestimating or underestimating the outcomes.
Mindmap
Keywords
💡Residuals
💡Actual Point
💡Predicted Point
💡Best Fit Line
💡Explanatory Variable
💡Dependent Variable
💡Scatter Plot
💡Vertical Distance
💡Positive Residual
💡Negative Residual
💡Underestimated
💡Overestimated
Highlights
A residual is defined as the difference between an actual data point and a predicted one.
The formula for a residual is the actual point minus the predicted point (Actual - Predicted).
Residuals measure the vertical distance between data points and the line of best fit.
In the context of residuals, 'actual' refers to the y-value of an ordered pair, while 'predicted' refers to the y-hat value.
A positive residual indicates that the actual point is above the best fit line, meaning the model has underestimated the value.
A negative residual indicates that the actual point is below the best fit line, suggesting the model has overestimated the value.
The larger the distance from the best fit line, the larger the residual.
An example is provided where the explanatory variable x represents hours, and y represents the number of people attending a lecture.
As the number of hours increases, the number of people attending the lecture decreases, simulating a negative relationship.
A scatter plot is used to visualize the relationship between hours and the number of attendees, with a line of best fit.
The equation of the best fit line is provided to predict the number of attendees based on hours.
A specific example calculation of a residual is given for when the explanatory variable x is 3 hours.
The predicted number of attendees at 3 hours is calculated to be 45.46, using the best fit line equation.
The actual number of attendees at 3 hours is 50, leading to a residual calculation of 4.54.
The process of calculating a residual involves finding the predicted value from the best fit line and then subtracting it from the actual value.
Residuals can be used to assess the accuracy of a model and to identify patterns or outliers in data.
The concept of residuals is fundamental in regression analysis and helps in refining models for better predictions.
Transcripts


5.0 / 5 (0 votes)
Thanks for rating: