Interpreting Linear Regression Results
TLDRThe video script discusses the analysis of a linear regression using the King County house data set, focusing on predicting house prices based on square footage. It emphasizes the importance of R-squared, the regression model's ability to explain data variance, and the significance of the F-stat and coefficient's p-values. The script highlights a positive relationship between the independent variable (square footage) and the dependent variable (price), and validates the model's effectiveness with a high F-stat significance and a good coefficient, concluding that larger houses tend to be more expensive.
Takeaways
- 📊 The focus of the analysis is on linear regression using the King County house data set.
- 🏠 The dependent variable of interest is the house price, and the independent variable is the square footage of living space.
- 🎨 Data visualization is used to plot a scatter plot to understand the relationship between the variables.
- 📈 A linear regression model is assumed to have the form y = mx + b, where m is the coefficient and b is the intercept.
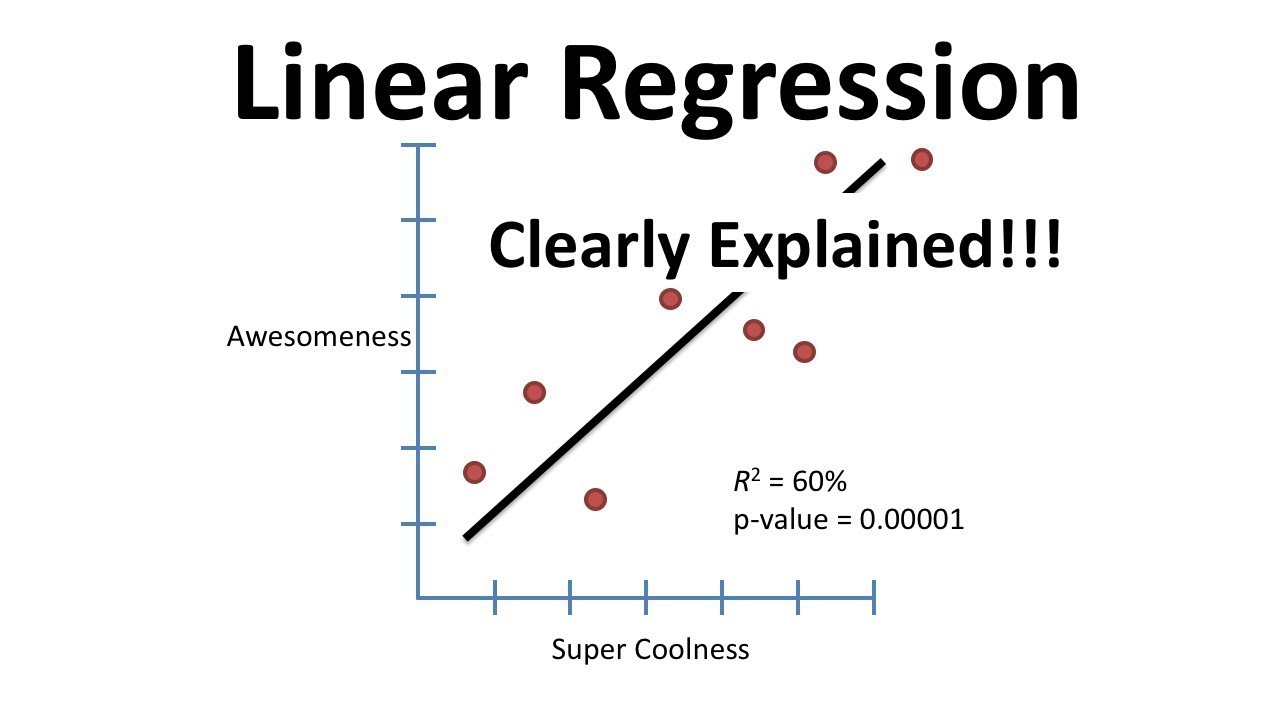
- 🔢 The R-squared value indicates the proportion of the variance in the dependent variable that is predictable from the independent variable(s).
- 🌟 An R-squared value of 0.468 suggests that 46.8% of the variance in house prices can be explained by the square footage.
- 📊 A high R-squared value (above 0.9) is often sought in research, but values less than this are acceptable depending on the context.
- 🔍 The ANOVA table provides information about the significance of the regression model, with the F-statistic and its significance being key.
- ✅ A low p-value (<0.01, <0.05, <0.10) for the F-statistic indicates strong evidence against the null hypothesis, suggesting a good model fit.
- 📈 The coefficient of the independent variable (square footage) determines the direction and strength of the relationship with the dependent variable (price).
- 🔧 The t-statistic and its associated p-value are used to test the significance of the individual coefficients in the model.
- 💡 The analysis concludes that square footage is a sensible predictor for house prices, as larger homes tend to be more expensive.
Q & A
What is the main focus of the analysis in the transcript?
-The main focus of the analysis is to examine the relationship between the price of houses and their square footage living, using the King County house data set.
What is the dependent variable in this linear regression analysis?
-The dependent variable in this analysis is the price of the houses.
What is the independent variable used to predict the price of houses?
-The independent variable used to predict the price of houses is the square footage living.
What does the R-squared value indicate in a regression analysis?
-The R-squared value indicates the proportion of the variance in the dependent variable that is predictable from the independent variable(s).
What is the R-squared value in this particular analysis?
-The R-squared value in this analysis is 0.468, which means that 46.8% of the variance in house prices can be explained by the square footage living.
What does the F-statistic signify in the context of the ANOVA table?
-The F-statistic is used to test the null hypothesis that all regression coefficients are equal to zero. A significant F-statistic (very low p-value) indicates that the model is a good fit and that at least one of the coefficients is significantly different from zero.
What is the significance level (alpha) typically used in statistical tests?
-The significance level (alpha) is the probability of rejecting the null hypothesis when it is actually true. Commonly used alpha levels are 0.01, 0.05, and 0.10.
What does a positive coefficient indicate in the context of the relationship between variables?
-A positive coefficient indicates that there is a positive relationship between the dependent and independent variables, meaning as the independent variable increases, the dependent variable also increases.
How is the t-statistic used in regression analysis?
-The t-statistic is used to test the null hypothesis that a particular coefficient is equal to zero. A significant t-statistic (low p-value) indicates that the coefficient is significantly different from zero and is a meaningful predictor in the model.
What is the p-value associated with the coefficient in this analysis?
-The p-value associated with the coefficient in this analysis is extremely close to zero, indicating that the coefficient is statistically significant and not equal to zero.
What are the four main questions one should ask when conducting a regression analysis?
-The four main questions are: 1) How much of the data does this model explain? 2) Is this a good model? 3) What is the relationship between the dependent and independent variables? 4) Do I have a good variable (i.e., is the coefficient significant)?
What additional factors might affect house prices beyond square footage living?
-Additional factors that might affect house prices include location, number of stories, presence of a waterfront view, and other amenities or features of the property.
Outlines
📊 Introduction to Linear Regression Analysis
The speaker begins by introducing the topic of linear regression analysis, specifically focusing on the King County house data set. The goal is to predict house prices based on various features such as bedrooms, bathrooms, and square footage. The speaker emphasizes the importance of the 'square footage living' as the primary independent variable for predicting the 'price' variable. The initial step involves organizing the data and creating a scatter plot to visualize the potential linear relationship between the variables. The speaker also mentions the intention to calculate the regression equation (y = mx + b) to understand how the square footage living area might predict the house prices.
📈 Interpreting Regression Results and R-Squared Value
In this section, the speaker delves into the interpretation of regression results, particularly focusing on the R-squared value. R-squared, which ranges from 0 to 1, indicates the proportion of the variance for the dependent variable that's explained by the independent variables in the model. The speaker acknowledges that while a higher R-squared value is often sought in research, an R-squared of less than 0.9 is acceptable for undergraduate projects. The speaker also discusses the significance of the F-statistic, which is used to determine if the regression model is a good fit for the data. The F-statistic's significance level is found to be extremely low, indicating a strong rejection of the null hypothesis and thus confirming the model's validity at various alpha levels (0.01, 0.05, and 0.10).
🔍 Analyzing Coefficients and Model Acceptability
The speaker moves on to discuss the coefficients in the regression model, focusing on the coefficient of the 'square footage living' variable. The sign of the coefficient indicates the nature of the relationship between the independent and dependent variables; a positive sign implies that as 'square footage living' increases, so does the 'price'. The speaker also emphasizes the importance of the significance of the coefficient, which is determined by the t-statistic and p-value. The p-value is found to be significantly lower than the alpha levels, confirming the coefficient's statistical significance and thus validating the model's predictive power.
🏠 Making Sense of the Regression Analysis
In the final paragraph, the speaker reflects on the overall regression analysis, summarizing the key findings. The analysis shows that the model explains about half of the data, which is deemed reasonable. The speaker also reiterates that the model is a good fit, as indicated by the low p-value for the F-statistic and the significant coefficient for 'square footage living'. The speaker concludes by considering the practical sense of the model, noting that it is logical to assume that larger houses with more living space would generally be more expensive. While acknowledging that other variables like location, number of stories, and views can also affect price, the speaker confirms that focusing on 'square footage living' alone provides a sensible and valid prediction for house prices.
Mindmap
Keywords
💡Linear Regression
💡R-squared
💡ANOVA
💡Coefficient
💡Intercept
💡Scatter Plot
💡F-statistic
💡t-statistic
💡p-value
💡Data Analysis
💡Model Fit
Highlights
The analysis focuses on linear regression using the King County house data set.
The goal is to predict house prices based on variables such as square footage and bedrooms.
Square footage living and price are chosen as the key variables for analysis.
A classic scatter plot is used to visualize the relationship between the variables.
The regression model is represented as y = mx + b, where m is the slope and b is the intercept.
R-squared is emphasized as a crucial statistic, explaining 46.8% of the data variance.
An R-squared value less than 0.9 is acceptable in this context, contrary to traditional expectations.
The number of observations, 500, is highlighted as a sufficient sample size for the analysis.
The ANOVA table is discussed, with a focus on the F-statistic and its significance.
The F-statistic's significance is reported as practically zero, indicating a strong model.
The regression model is deemed acceptable at alpha levels of 0.01, 0.05, and 0.10.
The coefficient's relationship is identified as positive, meaning as one variable increases, so does the other.
The coefficient's significance is also very low, indicating a strong and reliable relationship.
The four key questions in regression analysis are outlined: R-squared, model validity, relationship type, and variable quality.
The practical application of the model is questioned, and it is deemed logical that larger square footage correlates with higher house prices.
Transcripts


5.0 / 5 (0 votes)
Thanks for rating: