Calculating Residuals and MSE for Regression by hand
TLDRThis video script demonstrates the process of calculating residuals and estimating Sigma squared for a least squares regression line. It uses a simple dataset and the equation Y hat = 1.5 + 1.5x to predict values and determine the differences between observed and predicted Y values. The script then explains how to compute the mean squared error (MSE), also known as Sigma squared, by summing the squares of the residuals and dividing by the appropriate denominator. The example illustrates the foundational concepts of regression analysis in an accessible manner.
Takeaways
- 📊 The script explains the process of calculating residuals and estimating Sigma squared in the context of least squares regression.
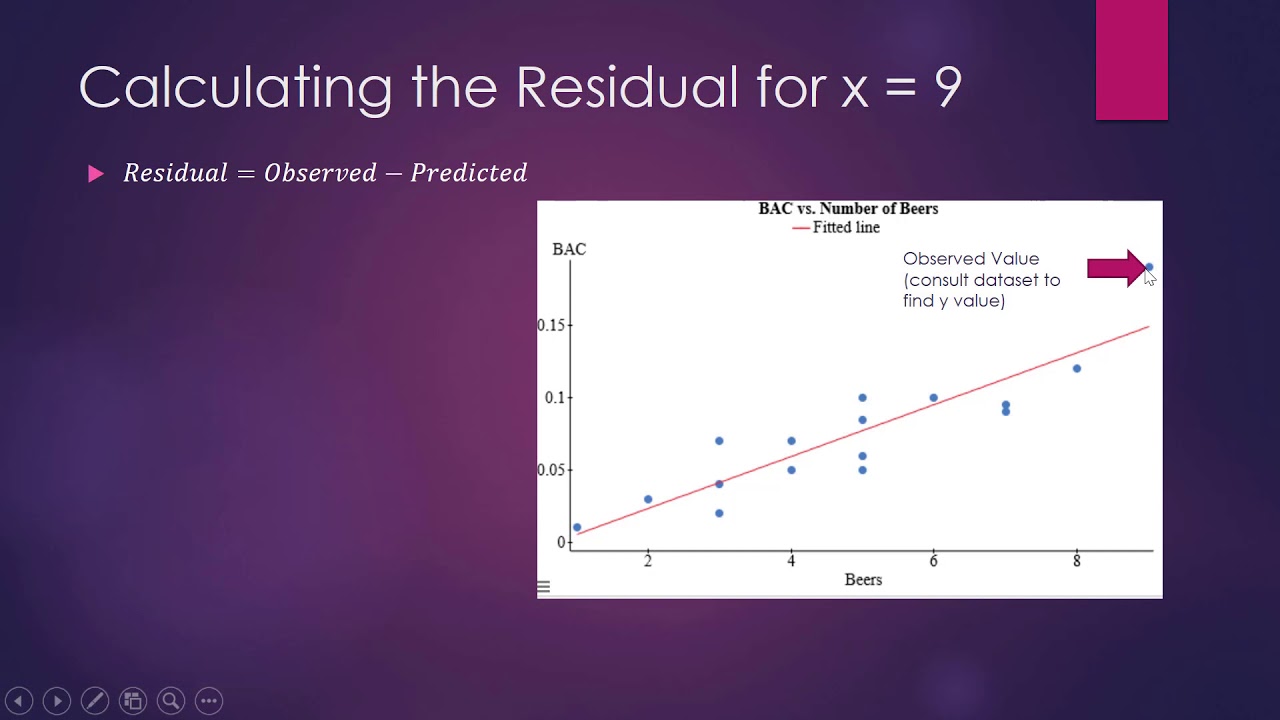
- 🔢 Residuals are the differences between the observed values (Y) and the predicted values (Y-hat) for the same X value.
- 📈 The least squares regression line is given as Y-hat = 1.5 + 1.5X, which is used to predict Y values based on X values.
- 🧮 For the first observation (X=1), the predicted value (Y-hat) is calculated as 3, using the given regression line.
- 📊 For the second observation (X=2), the predicted value (Y-hat) is 4.5, following the same calculation method.
- 📈 The predicted value for the last observation (X=3) is 6, as derived from the regression equation.
- 🤔 Residuals for each observation are calculated by subtracting the predicted values from the actual observed values.
- 📊 The script provides an example calculation of residuals: 0 for the first, 0.5 for the second, and 0 for the third observation.
- 🧠 Estimating Sigma squared (Σ²) involves summing the squared residuals and dividing by (n - k + 1), where n is the number of observations and k is the number of explanatory variables.
- 🔢 In this case, Sigma squared is estimated to be 0.25, calculated by squaring the residuals and dividing by 2 (since n=4 and k=1).
- 📝 The estimated Sigma squared represents the mean squared error (MSE) and is an indicator of the true variation in the population or sample data.
- 💡 The process demonstrated in the script can be automated using software, especially for larger datasets.
Q & A
What is the main purpose of calculating residuals in a least squares regression analysis?
-The main purpose of calculating residuals is to determine the difference between the observed values (Y) and the predicted values (Y-hat) for the same value of X. This helps in assessing the accuracy and fit of the regression model to the data.
Given the least squares regression line Y-hat = 1.5 + 1.5X, how do you calculate the predicted value for the first observation when X is equal to 1?
-For the first observation where X is equal to 1, you substitute the value of X into the regression equation. So, Y-hat = 1.5 + 1.5(1), which simplifies to Y-hat = 3.
What is the predicted value of Y when X is 2 in the given example?
-When X is 2, the predicted value of Y (Y-hat) is calculated as 1.5 + 1.5(2), which equals 4.5.
How do you calculate the residual for the second observation in the data set?
-The residual for the second observation is calculated by subtracting the predicted value (Y-hat) from the actual observed value (Y). If Y is 4.5 for the observed value when X is 2, then the residual is 4.5 - 4.5, which equals 0.
What is the formula for calculating the estimate of Sigma squared (Σ²) in the context of least squares regression?
-The estimate of Sigma squared (Σ²), also known as the mean squared error (MSE), is calculated using the formula Σ(Y - Y-hat)² / (N - k), where N is the number of observations, k is the number of parameters in the model (including the intercept), and the sum is taken over all observations.
In the provided script, what is the value of k in the calculation of Sigma squared?
-In the provided script, k is equal to 1 because there is only one explanatory variable (X) in the model.
How many residuals were calculated in the example provided in the script?
-Three residuals were calculated in the example, one for each observation in the data set.
What does the value of the estimated Sigma squared indicate in a regression analysis?
-The estimated Sigma squared represents the average squared deviation of the residuals from the predicted values. It is an estimate of the true variation in the population or sample, providing a measure of the model's accuracy and the degree of dispersion around the regression line.
What is the estimated Sigma squared for the small data set in the script?
-The estimated Sigma squared for the small data set in the script is 0.25.
How can software be utilized in calculating residuals and Sigma squared for larger data sets?
-Software can automate the calculations of residuals and Sigma squared, making the process more efficient and less prone to human error. It can handle large amounts of data and perform the necessary computations quickly and accurately.
What is the significance of calculating residuals and Sigma squared in the context of model validation?
-Calculating residuals and Sigma squared is crucial for model validation as it allows us to assess the model's performance and fit to the data. It helps in identifying patterns in the residuals that might indicate issues with the model, such as non-linearity or the presence of outliers, and provides a quantitative measure of the model's predictive accuracy.
Outlines
📊 Calculating Residuals and Estimating Sigma Squared
This paragraph explains the process of calculating residuals and estimating Sigma squared (σ^2) using the least squares regression line, Y hat = 1.5 + 1.5x, for a given small data set. It details the steps to find the predicted values (Y hat) for different X values, and then how to compute the residuals (Y - Y hat) as the difference between observed and predicted Y values. The calculation involves plugging in X values into the regression equation and finding the discrepancies for each observation. The paragraph also describes how to estimate the mean squared error (MSE), which is equivalent to σ^2, by summing the squared residuals and dividing by (n - k + 1), where n is the number of data points and k is the number of explanatory variables. The example uses a data set with 4 observations and 1 explanatory variable (X), leading to a denominator of (4 - 1 + 1) for the MSE calculation. The result is an estimated σ^2 value of 0.25, representing the true variation in the population or sample.
📱 Using Software for Large Data Sets
The second paragraph briefly discusses the practicality of using software for calculating residuals and estimating Sigma squared for larger data sets. It suggests that while the manual calculation demonstrated in the previous paragraph is feasible for small data sets, it is more efficient and likely to be employed when dealing with a larger volume of data. The paragraph implies that software can automate the process, reducing the potential for human error and saving time, without going into specifics about the software or the automation process.
Mindmap
Keywords
💡residuals
💡least squares regression line
💡Sigma squared (Σ²)
💡predicted value (y-hat)
💡observed value (y)
💡mean squared error (MSE)
💡regression analysis
💡coefficients
💡variance
💡data points
💡model accuracy
Highlights
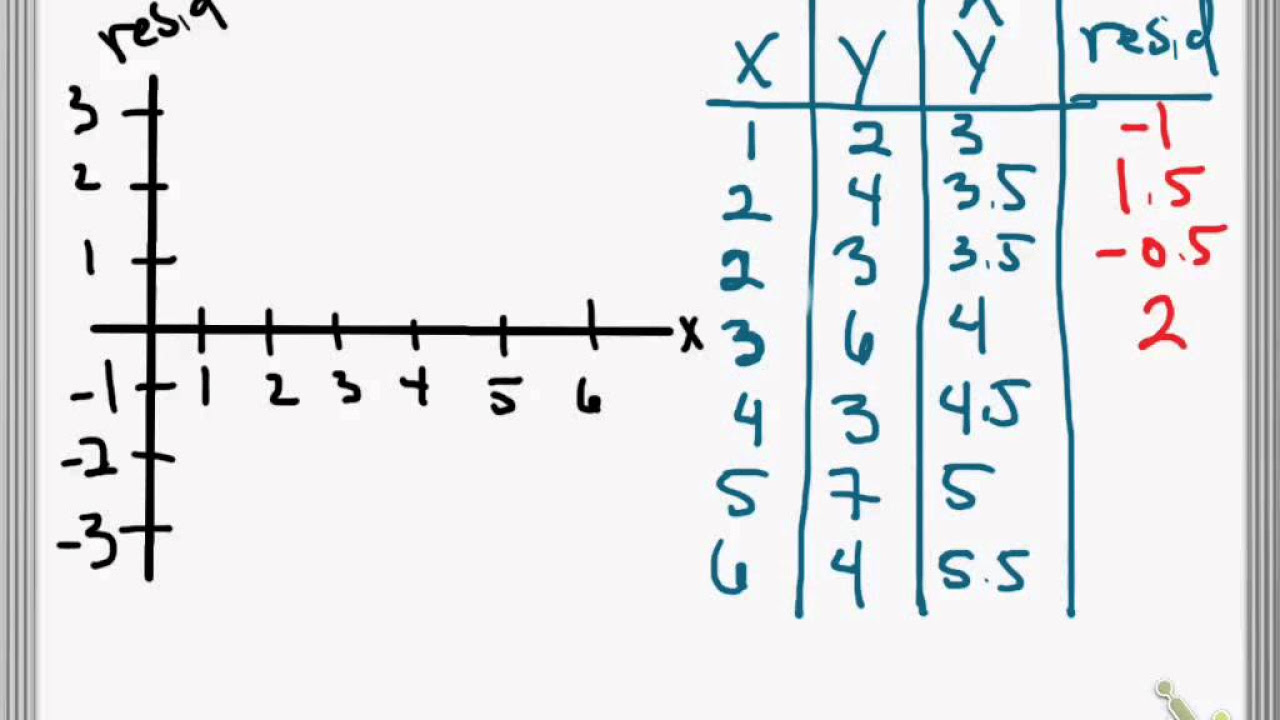
Calculation of residuals using the least squares regression line formula Y hat = 1.5 + 1.5x
Explanation of residuals as the difference between observed and predicted values for the same x value
Step-by-step calculation of predicted y-values for given x-values in the data set
Use of the first observation (X=1) to demonstrate the calculation of the predicted value (Y hat = 3)
Application of the regression line formula to find the predicted value for X=2 (Y hat = 4.5)
Computation of the predicted value for the last observation with X=3 (Y hat = 6)
Derivation of residuals for each data point by subtracting the predicted values from the observed values
Example calculation of residuals showing 0.5 and 0 for the first two observations
Description of the process to calculate the estimate for Sigma squared (MSE) using residuals
Explanation of the formula for Sigma squared calculation as the sum of squared residuals divided by (N - K + 1)
Use of the given data set to calculate the value of Sigma squared (0.25) using the residuals and the formula
Clarification that Sigma squared represents the true variation in the population or the mean squared error in a sample
Suggestion that the calculations can be performed using software for larger data sets
Demonstration of the entire process from calculating predicted values to estimating Sigma squared for a small data set
The importance of understanding the relationship between observed and predicted values in regression analysis
The role of residuals in assessing the fit of the regression model to the data
The significance of Sigma squared in determining the variability and accuracy of the regression model
Transcripts
Browse More Related Video
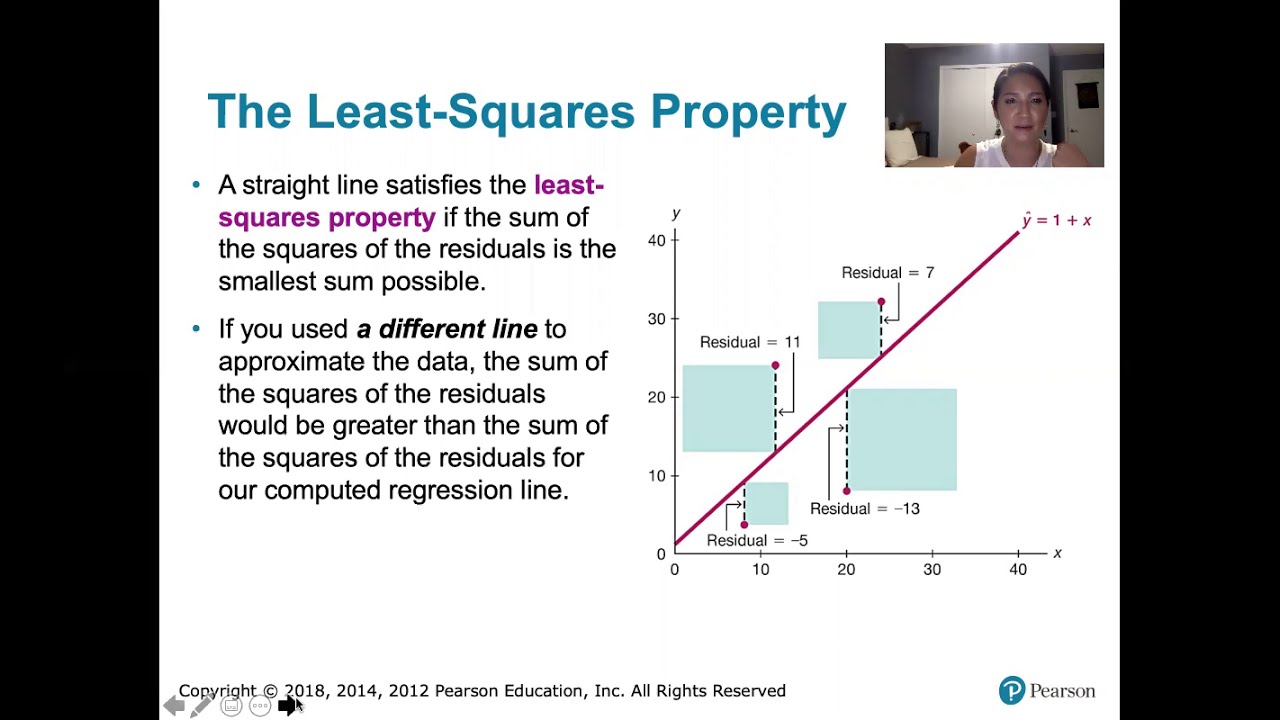
10.2.5 Regression - Residuals and the Least-Squares Property
Residuals and Residual Plots
Introduction to residuals and least squares regression
The Main Ideas of Fitting a Line to Data (The Main Ideas of Least Squares and Linear Regression.)
How to Calculate the Residual
Introduction to REGRESSION! | SSE, SSR, SST | R-squared | Errors (ε vs. e)
5.0 / 5 (0 votes)
Thanks for rating: