Regression Analysis | Full Course
TLDRThis comprehensive video tutorial introduces viewers to regression analysis, explaining the concepts of simple and multiple linear regression, as well as logistic regression. It covers the fundamentals, including interpreting results, understanding assumptions, and using dummy variables. The video also demonstrates how to perform regression analysis online, offering practical guidance for predicting and understanding variables' influence in various contexts such as salary, hospital stay, and risk of burnout.
Takeaways
- 📊 Regression analysis enables prediction or inference of a variable based on other variables.
- 🔍 Simple linear regression involves using a single independent variable to predict the dependent variable, while multiple linear regression uses multiple independent variables.
- 📈 The goal of regression analysis can be to measure the influence of variables or to predict a variable's value.
- 🤔 In logistic regression, the dependent variable is categorical, such as yes/no or binary outcomes.
- 📐 The use of dummy variables is necessary when dealing with categorical variables with more than two categories.
- 🔢 The scale level of the dependent variable can be metric, ordinal, or nominal in different types of regression.
- 🏥 Example applications of regression include predicting hospital stay lengths, children's concentration abilities, and sales in online stores.
- 📊 A scatter plot visually represents the relationship between dependent and independent variables, with a straight line indicating the prediction model.
- 🧠 Understanding assumptions of linear regression, such as linearity, normal distribution of errors, no multicollinearity, and constant variance of residuals (homoscedasticity), is crucial for accurate analysis.
- 🔧 The method of least squares is used to determine the best-fit line in a scatter plot for linear regression.
- 💻 Online tools like Data Tab can simplify the process of calculating regressions and checking their assumptions.
Q & A
What is the primary purpose of regression analysis?
-The primary purpose of regression analysis is to infer or predict a variable based on one or more other variables. It helps in understanding the relationship between dependent and independent variables and can be used for both measuring influence and making predictions.
What are the two main goals of regression analysis?
-The two main goals of regression analysis are: 1) to measure the influence of one or several variables on another variable, and 2) to predict a variable based on other variables.
What is the difference between simple linear regression and multiple linear regression?
-Simple linear regression uses only one independent variable to infer the dependent variable, while multiple linear regression uses several independent variables to infer the dependent variable.
What is a dependent variable in regression analysis?
-A dependent variable in regression analysis is the variable that is being predicted or inferred based on the values of one or more independent variables.
What is a logistic regression used for?
-Logistic regression is used when the dependent variable is categorical, such as yes/no or binary outcomes. It helps in estimating the probability of the occurrence of a particular outcome based on the values of independent variables.
How can you calculate a regression analysis easily online?
-You can calculate a regression analysis easily online by using statistical tools or platforms like Data Tab. You simply input your data, select the dependent and independent variables, and the tool will perform the regression analysis for you.
What are the assumptions for a linear regression model?
-The assumptions for a linear regression model include: 1) a linear relationship between the dependent and independent variables, 2) normally distributed errors (epsilon), 3) no multicollinearity, and 4) constant variance of the residuals (homoscedasticity).
What is multicollinearity in the context of regression analysis?
-Multicollinearity refers to a situation in regression analysis where two or more independent variables are strongly correlated with each other, making it difficult to separate the individual effects of each variable on the dependent variable.
What are dummy variables used for in regression analysis?
-Dummy variables are used in regression analysis for categorical variables with more than two values. They transform the categorical data into a format that can be used in the regression model by creating new variables that represent the presence or absence (0 or 1) of each category.
How is the logistic function used in logistic regression?
-The logistic function is used in logistic regression to ensure that the predicted values are between 0 and 1, which represents probabilities. It is applied to the linear regression equation to estimate the probability of the occurrence of a particular outcome based on the independent variables.
What is the main difference between the dependent variable in linear and logistic regression?
-In linear regression, the dependent variable is metric, meaning it can be continuous or discrete numerical values. In contrast, in logistic regression, the dependent variable is categorical, often representing binary outcomes such as yes/no or 0/1.
Outlines
📚 Introduction to Regression Analysis
This paragraph introduces the concept of regression analysis, highlighting its purpose and applications. It explains the difference between simple linear regression and multiple linear regression, and touches on the use of dummy variables. The speaker, Hannah, welcomes viewers to a comprehensive course on regression analysis, promising to cover the basics of logistic regression and demonstrate how to perform regression calculations online. The key points include understanding the dependent and independent variables, the goals of regression analysis, and the types of regression analysis, including simple linear, multiple linear, and logistic regression.
📈 Understanding Simple and Multiple Linear Regression
This paragraph delves deeper into simple and multiple linear regression, explaining their differences and applications. It describes how simple linear regression uses one independent variable to predict the dependent variable, while multiple linear regression uses several independent variables for prediction. The paragraph also discusses the importance of understanding the scale level of variables and the concept of dummy variables for nominal or ordinal independent variables. The summary emphasizes the goal of estimating one variable based on others, controlling for third-party variables, and the interpretation of regression results.
🧠 Calculation and Interpretation of Regression Results
This paragraph focuses on the calculation and interpretation of regression results, particularly for multiple linear regression. It explains how to perform regression analysis online using a tool like Data Tab and how to interpret the results, including the model summary, coefficients, and significance levels. The paragraph highlights the meaning of the multiple correlation coefficient (R), the coefficient of determination (R squared), and the standard error of the estimate. It also discusses the F-test and its role in testing the null hypothesis regarding the variance explanation. The summary underscores the importance of checking assumptions for linear regression, such as linearity, normal distribution of errors, multicollinearity, and homoscedasticity.
🔍 Assessing Regression Assumptions and Dummy Variables
This paragraph discusses the assumptions necessary for linear regression and how to assess them, including linearity, normal distribution of residuals, constant variance (homoscedasticity), and absence of multicollinearity. It explains the methods for checking these assumptions, such as graphical analysis and statistical tests. The paragraph also explains the use of dummy variables for categorical independent variables with more than two values, detailing the process of creating dummy variables and their role in regression analysis. The summary emphasizes the importance of meeting regression assumptions for valid results and the practical steps for diagnosing and addressing issues like multicollinearity and heteroscedasticity.
📊 Logistic Regression for Categorical Outcomes
This paragraph introduces logistic regression, a statistical method used when the dependent variable is categorical. It contrasts logistic regression with linear regression, explaining that logistic regression estimates the probability of a certain outcome rather than predicting a metric value. The paragraph describes the logistic function and its role in ensuring that predictions fall within the 0 to 1 range. It also outlines how logistic regression coefficients are determined using the maximum likelihood method. The summary highlights the process of predicting categorical outcomes, such as disease risk or product purchase likelihood, and demonstrates how to perform logistic regression online using Data Tab.
Mindmap
Keywords
💡Regression Analysis
💡Dependent Variable
💡Independent Variables
💡Dummy Variables
💡Logistic Regression
💡Linear Relationship
💡Multiple Correlation Coefficient (R)
💡Coefficients
💡Error (Epsilon)
💡Multicollinearity
💡Heteroscedasticity
Highlights
Regression analysis allows for the prediction or inference of a variable based on one or more other variables.
The dependent variable, or criterion, is what is being predicted or inferred in a regression analysis.
Independent variables, or predictors, are used to predict the outcome of the dependent variable in regression analysis.
Simple linear regression uses one independent variable to predict the dependent variable, while multiple linear regression uses several.
Logistic regression is used when the dependent variable is categorical, such as yes/no or binary outcomes.
Dummy variables are used in regression analysis to represent categorical variables with more than two characteristics.
The method of least squares is used in linear regression to determine the best-fit line through a scatter plot of data points.
The slope (b) and intercept (a) of the regression line are calculated to create a model for predicting the dependent variable.
The correlation between the dependent and independent variables is measured by the multiple correlation coefficient (r).
The coefficient of determination (r squared) indicates how much of the variance in the dependent variable is explained by the independent variables.
The standard error of the estimate indicates the average magnitude of the prediction errors in a regression model.
The F-test is used to test the null hypothesis that all regression coefficients are zero, helping to determine the overall significance of the model.
Linear regression assumptions include linearity between variables, normal distribution of errors, no multicollinearity, and constant variance of residuals (homoscedasticity).
Graphical methods like scatter plots and QQ plots can be used to check the normality assumption of the residuals in a regression analysis.
Multicollinearity can be diagnosed by creating new regression models for each independent variable and calculating tolerance or VIF values.
For categorical independent variables with more than two characteristics, dummy variables must be created, with n-1 rules to avoid redundancy.
Logistic regression estimates the probability of a categorical dependent variable occurring based on the values of independent variables.
The logistic function is used in logistic regression to ensure that the predicted probabilities fall within the range of 0 to 1.
Coefficients in logistic regression are determined using the maximum likelihood method to best represent the given data.
Online tools like DataTab can be used to easily perform linear and logistic regression analyses, including checking assumptions and creating dummy variables.
Transcripts
Browse More Related Video
Dummy Variables or Indicator Variables in R | R Tutorial 5.5 | MarinStatsLectures
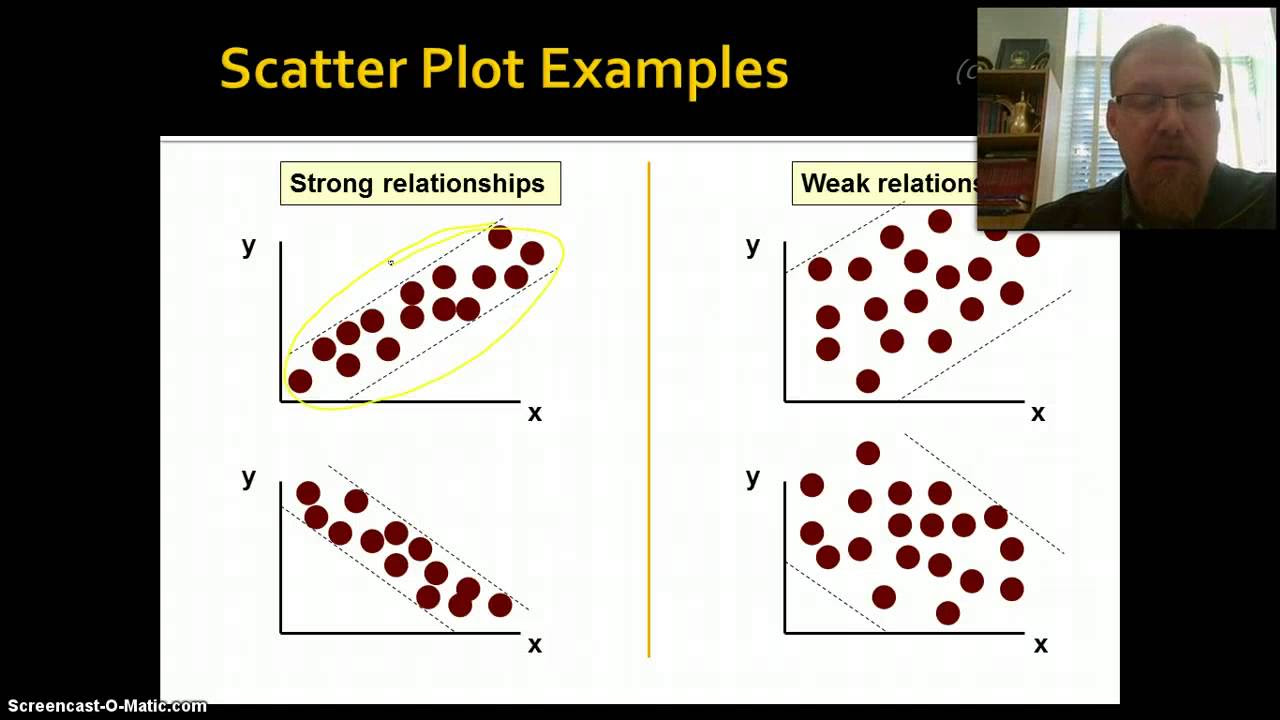
Introduction to Correlation & Regression, Part 1
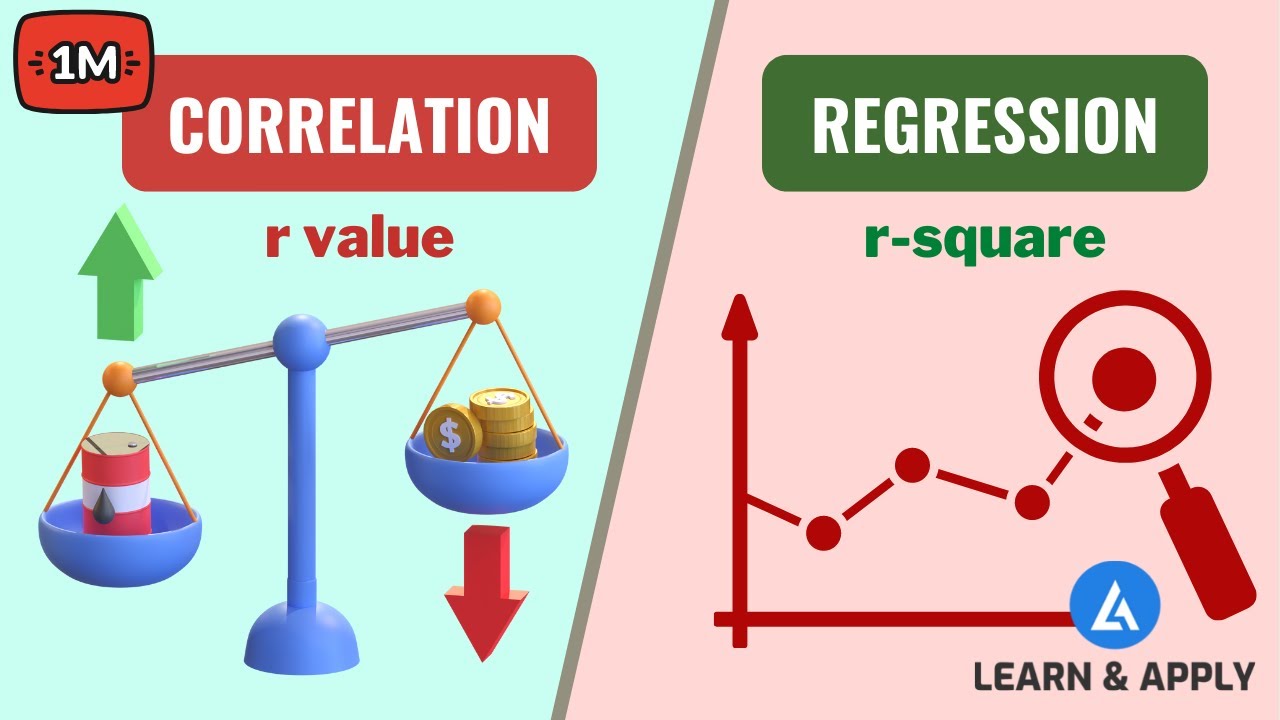
Correlation and Regression Analysis: Learn Everything With Examples
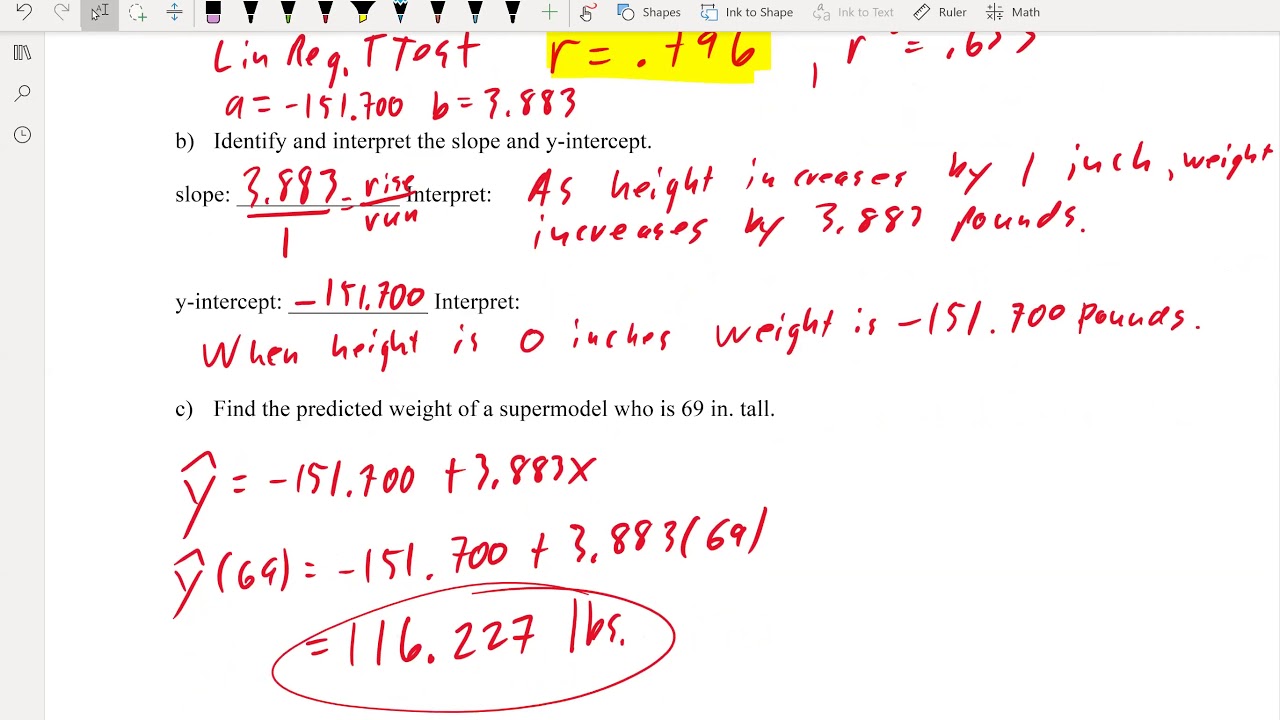
Math 119 Chapter 10 part 2

10.2.0 Regression - Lesson Overview, Key Concepts, and Learning Outcomes
Simple Linear Regression Concept | Statistics Tutorial #32 | MarinStatsLectures
5.0 / 5 (0 votes)
Thanks for rating: