10.2.0 Regression - Lesson Overview, Key Concepts, and Learning Outcomes
TLDRThis video lesson on regression from 'Essentials of Statistics' covers key concepts and learning outcomes for understanding linear regression. It introduces the regression line and equation, differentiates between deterministic and probabilistic models, and explains the role of explanatory and response variables. The lesson outlines methods to find the regression equation, discusses marginal change, influential points, and residual plots for analyzing correlation and regression results, aiming to clarify the terminology and techniques essential for regression analysis.
Takeaways
- 📚 The lesson is part of a series on statistics, focusing on chapter 10.2, which is about regression.
- 📈 The script discusses methods for finding the equation of a straight line, known as the regression line, that best fits a set of data points in a scatter plot.
- 🔍 The regression equation is derived from the data and is used to understand the relationship between variables.
- 📊 The script includes a discussion on how to graph regression lines and assess their fit to the data.
- 🔑 Six learning outcomes are associated with lesson 10.2, covering essential terminology, regression requirements, and analysis tools.
- 🔑🔑 The first learning outcome defines key terms such as regression line, regression equation, and the difference between deterministic and probabilistic models.
- 📝 The second learning outcome outlines the requirements for finding a regression equation and introduces three methods to determine the coefficients b0 and b1.
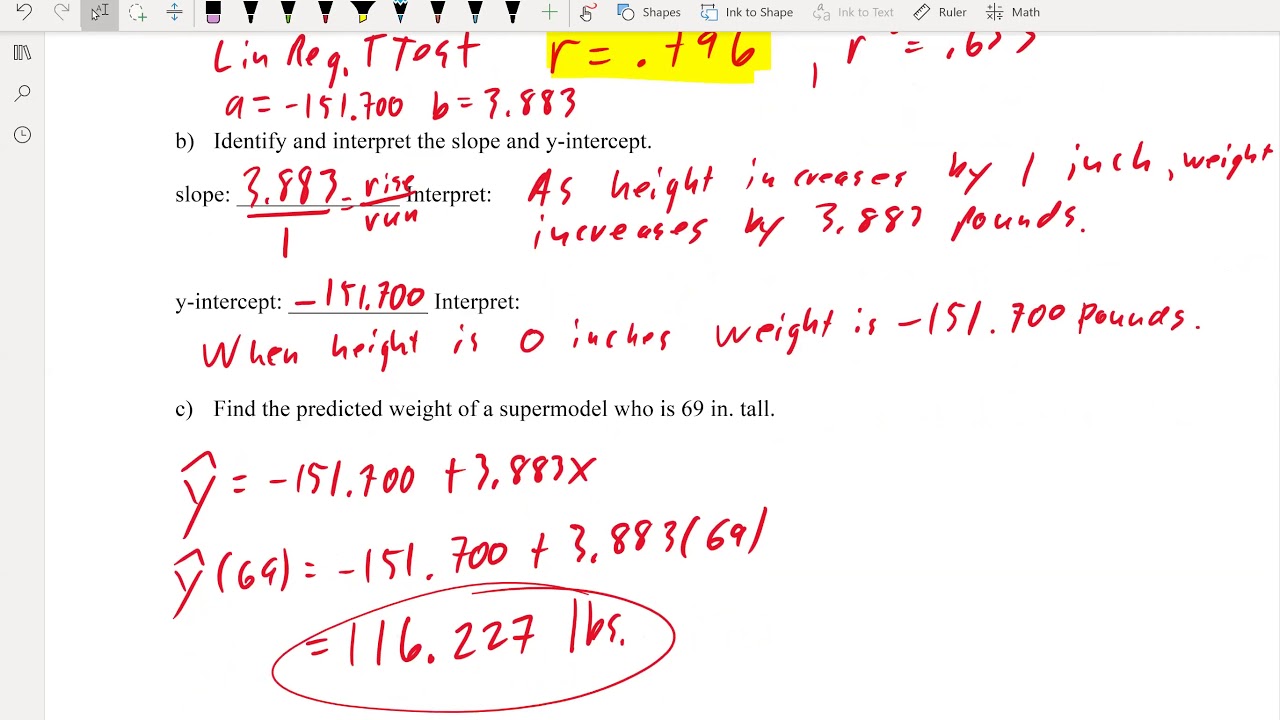
- 📐 The third learning outcome describes a strategy for predicting the value of y given an x value using the regression equation.
- 📊🔍 The fourth learning outcome defines outliers and influential points in the context of scatter plots and how to identify them.
- 📉 The fifth learning outcome explains residuals and the least squares property, which is the criterion for the best fit line.
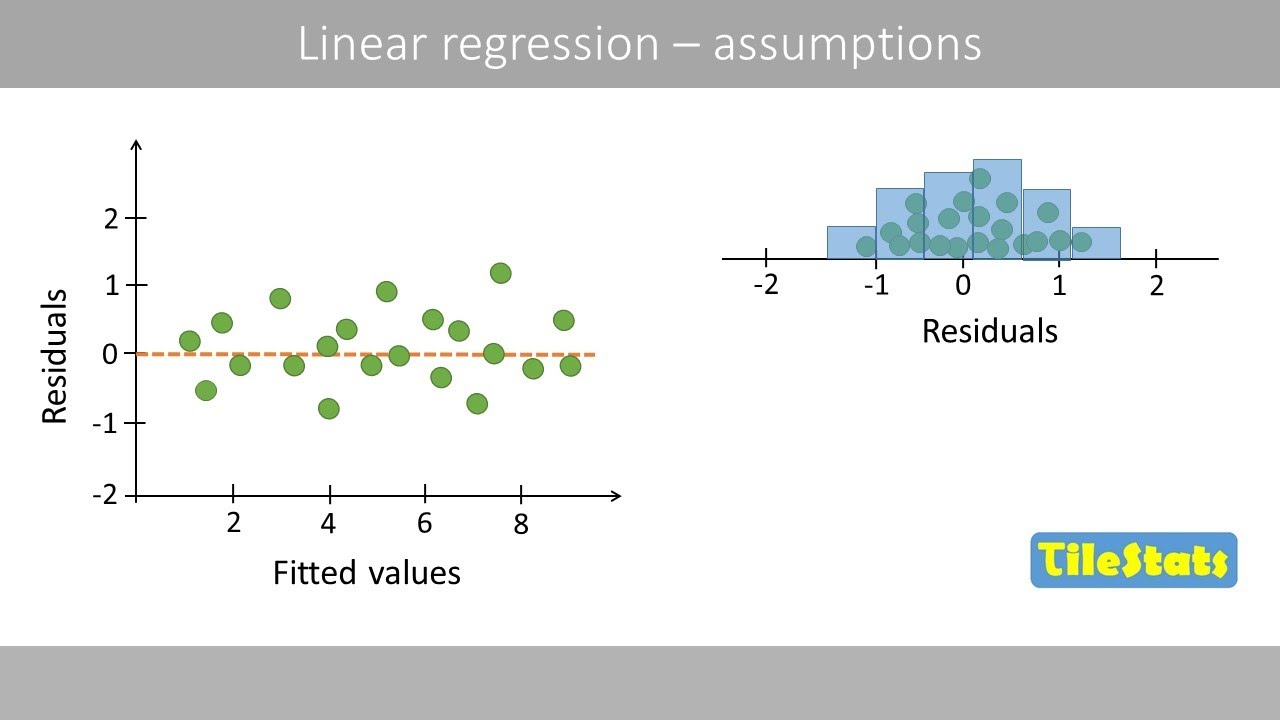
- 📈📊 The final learning outcome introduces residual plots as a tool for analyzing the fit of the regression model and what they suggest about the data.
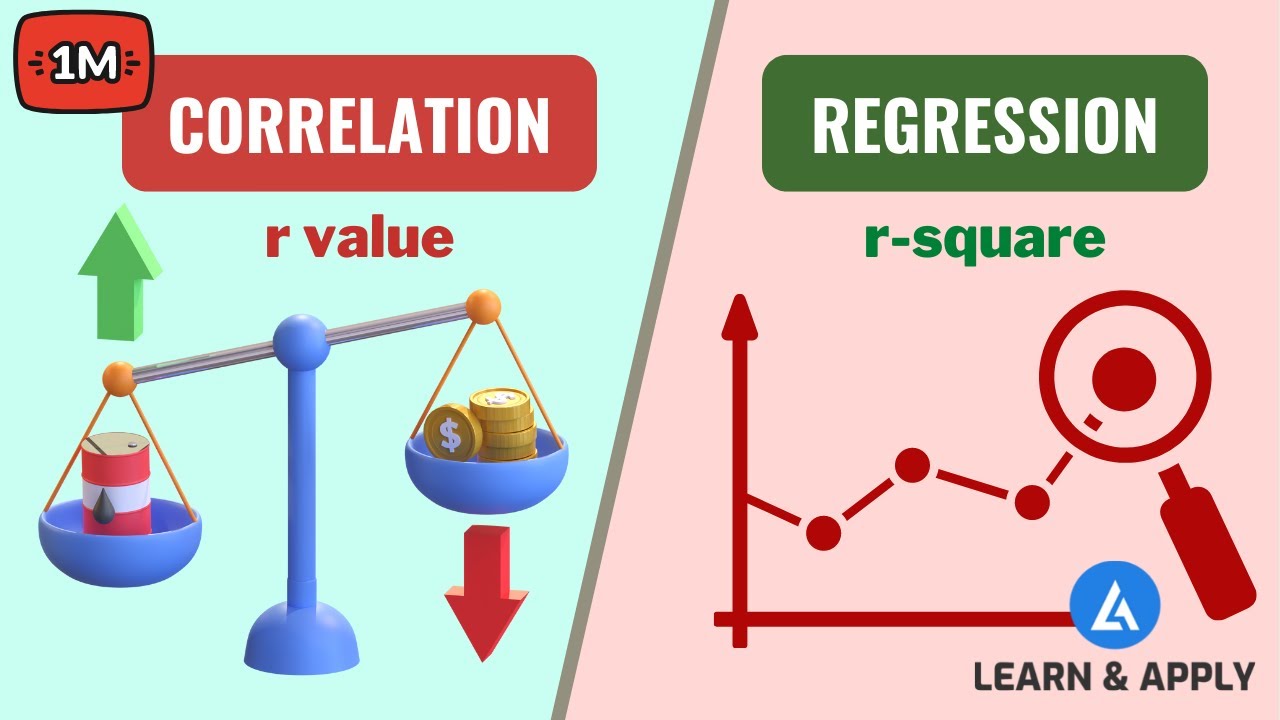
- 🔄 The script emphasizes the importance of understanding the difference between correlation and regression in statistical analysis.
Q & A
What is the main focus of the video lesson 10.2?
-The main focus of the video lesson 10.2 is on regression, specifically linear regression, including the concepts of the regression line and regression equation, and how they relate to paired sample data in a scatter plot.
What textbook is the lesson based on?
-The lesson is based on 'Essentials of Statistics 6th Edition' by Mario Triola.
What were the two sections covered from chapter 10 in the fall 2020 semester?
-The two sections covered from chapter 10 in the fall 2020 semester were 10.1 about correlation and linear correlation, and 10.2 about linear regression.
What is the best fitting straight line in a scatter plot of paired sample data called?
-The best fitting straight line in a scatter plot of paired sample data is called the regression line.
What is the equation of the regression line known as?
-The equation of the regression line is known as the regression equation.
What are the three methods for finding the coefficients b sub zero and b sub one in the linear regression equation?
-The script does not specify the three methods for finding the coefficients, but it mentions that these methods will be discussed in the video.
What is marginal change in the context of regression?
-The script does not provide a definition for marginal change within the provided transcript, but it is mentioned as a concept that will be discussed in the video.
What are the six learning outcomes associated with lesson 10.2?
-The six learning outcomes are: 1) Understanding and defining essential terminology in regression, 2) Requirements for finding a regression equation and three methods for finding it, 3) Strategy for finding the best predicted value of y given an x value, 4) Defining outliers and influential points, 5) Understanding residuals and the least squares property, and 6) Defining and using residual plots to analyze correlation and regression results.
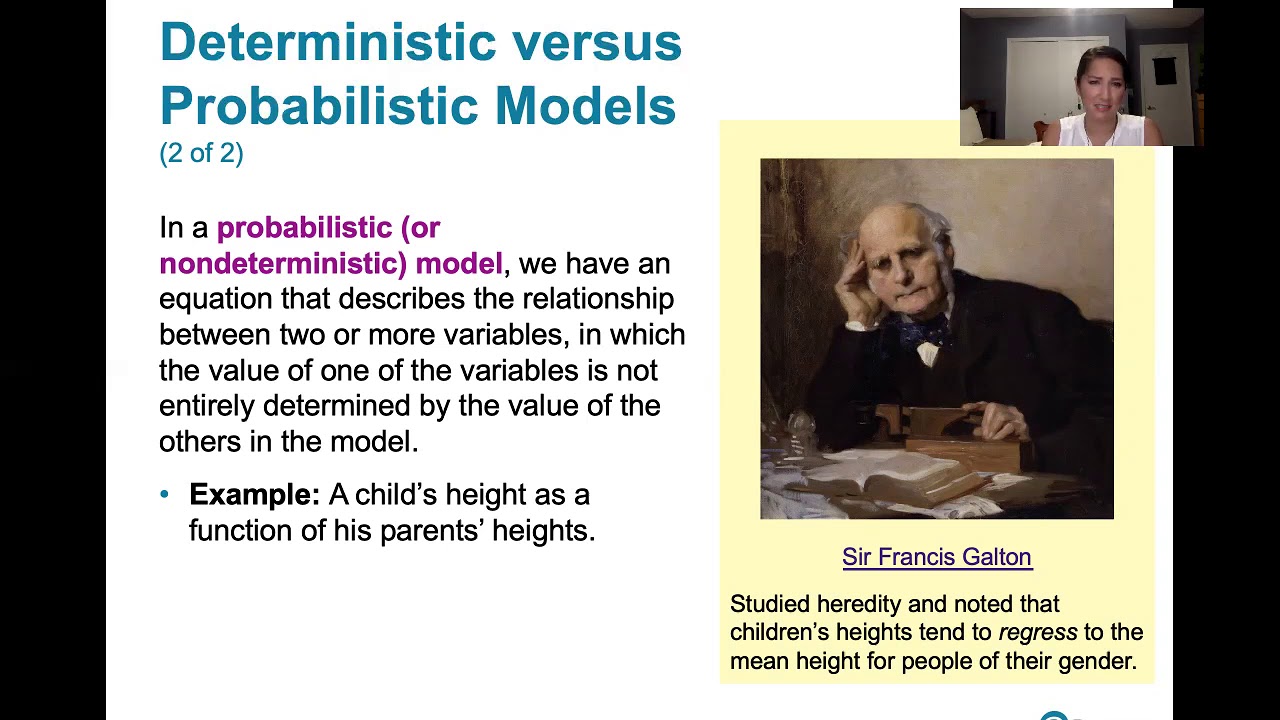
What is the difference between a deterministic model and a probabilistic model in the context of regression?
-The script does not provide a direct explanation of the difference between deterministic and probabilistic models, but it mentions that this will be discussed in the video.
What are the terms for explanatory variables and predictor variables in the context of regression?
-In the context of regression, explanatory variables and predictor variables are terms used to describe the independent variables that are used to predict the dependent variable.
How are residual plots used to analyze regression results?
-Residual plots are used to determine if a regression equation is a good model for the data by examining the characteristics of the plot, which can suggest properties about the original paired data.
Outlines
📚 Regression Lesson Overview
This paragraph introduces the video's focus on lesson 10.2, which covers the topic of regression. It mentions that the content is based on slides from Pearson, adapted for the course. The lesson is part of the 10th chapter in 'Essentials of Statistics' by Mario Triola. The video will cover key concepts such as finding the regression line and equation for paired sample data, understanding the correlation between data points, and the difference between deterministic and probabilistic models. It also outlines the learning outcomes for the lesson, which include defining essential terminology, understanding the requirements for regression equations, and analyzing influential points and residual plots.
Mindmap
Keywords
💡Regression
💡Regression Line
💡Regression Equation
💡Correlation
💡Linear Regression
💡Deterministic Model
💡Probabilistic Model
💡Explanatory Variables
💡Response Variables
💡Marginal Change
💡Influential Points
💡Residual Plots
💡Least Squares Property
Highlights
Lesson 10.2 focuses on regression, specifically linear regression.
The course material is based on 'Essentials of Statistics' 6th edition by Mario Triola.
The video covers methods for finding the equation of a straight line, the regression line, that best fits a scatter plot of paired sample data.
The regression equation is derived from the regression line and is related to the data.
The video discusses the graphical representation of regression lines and their fit to datasets.
Marginal change, influential points, and residual plots are tools for analyzing correlation and regression results.
Six learning outcomes are associated with lesson 10.2, including defining essential terminology in regression.
The difference between deterministic and probabilistic models is explained.
The definitions of explanatory, predictor, independent, response, and dependent variables are provided.
The concept of marginal change is introduced and its role in regression is discussed.
The video clarifies the difference between correlation and regression.
Requirements for finding a regression equation are outlined.
Three methods for finding the coefficients b sub zero and b sub one in the linear regression equation are presented.
A strategy for finding the best predicted value of y given a specific x value is described.
Outliers and influential points in scatter plots are defined and their impact on regression is discussed.
Residuals are introduced as a measure of the fit of the regression line to the data.
The least squares property of the best fit line is explained.
Residual plots are defined and their use in analyzing correlation and regression results is described.
The video concludes by examining how residual plots suggest the quality of the regression model and the nature of the original paired data.
Transcripts
Browse More Related Video
10.2.1 Regression - Essential Terminology and Background Related to Regression

Regression and R-Squared (2.2)
Math 119 Chapter 10 part 2
Correlation and Regression Analysis: Learn Everything With Examples
Assumptions in Linear Regression - explained | residual analysis
Simple Linear Regression Concept | Statistics Tutorial #32 | MarinStatsLectures
5.0 / 5 (0 votes)
Thanks for rating: